
Figure 4:
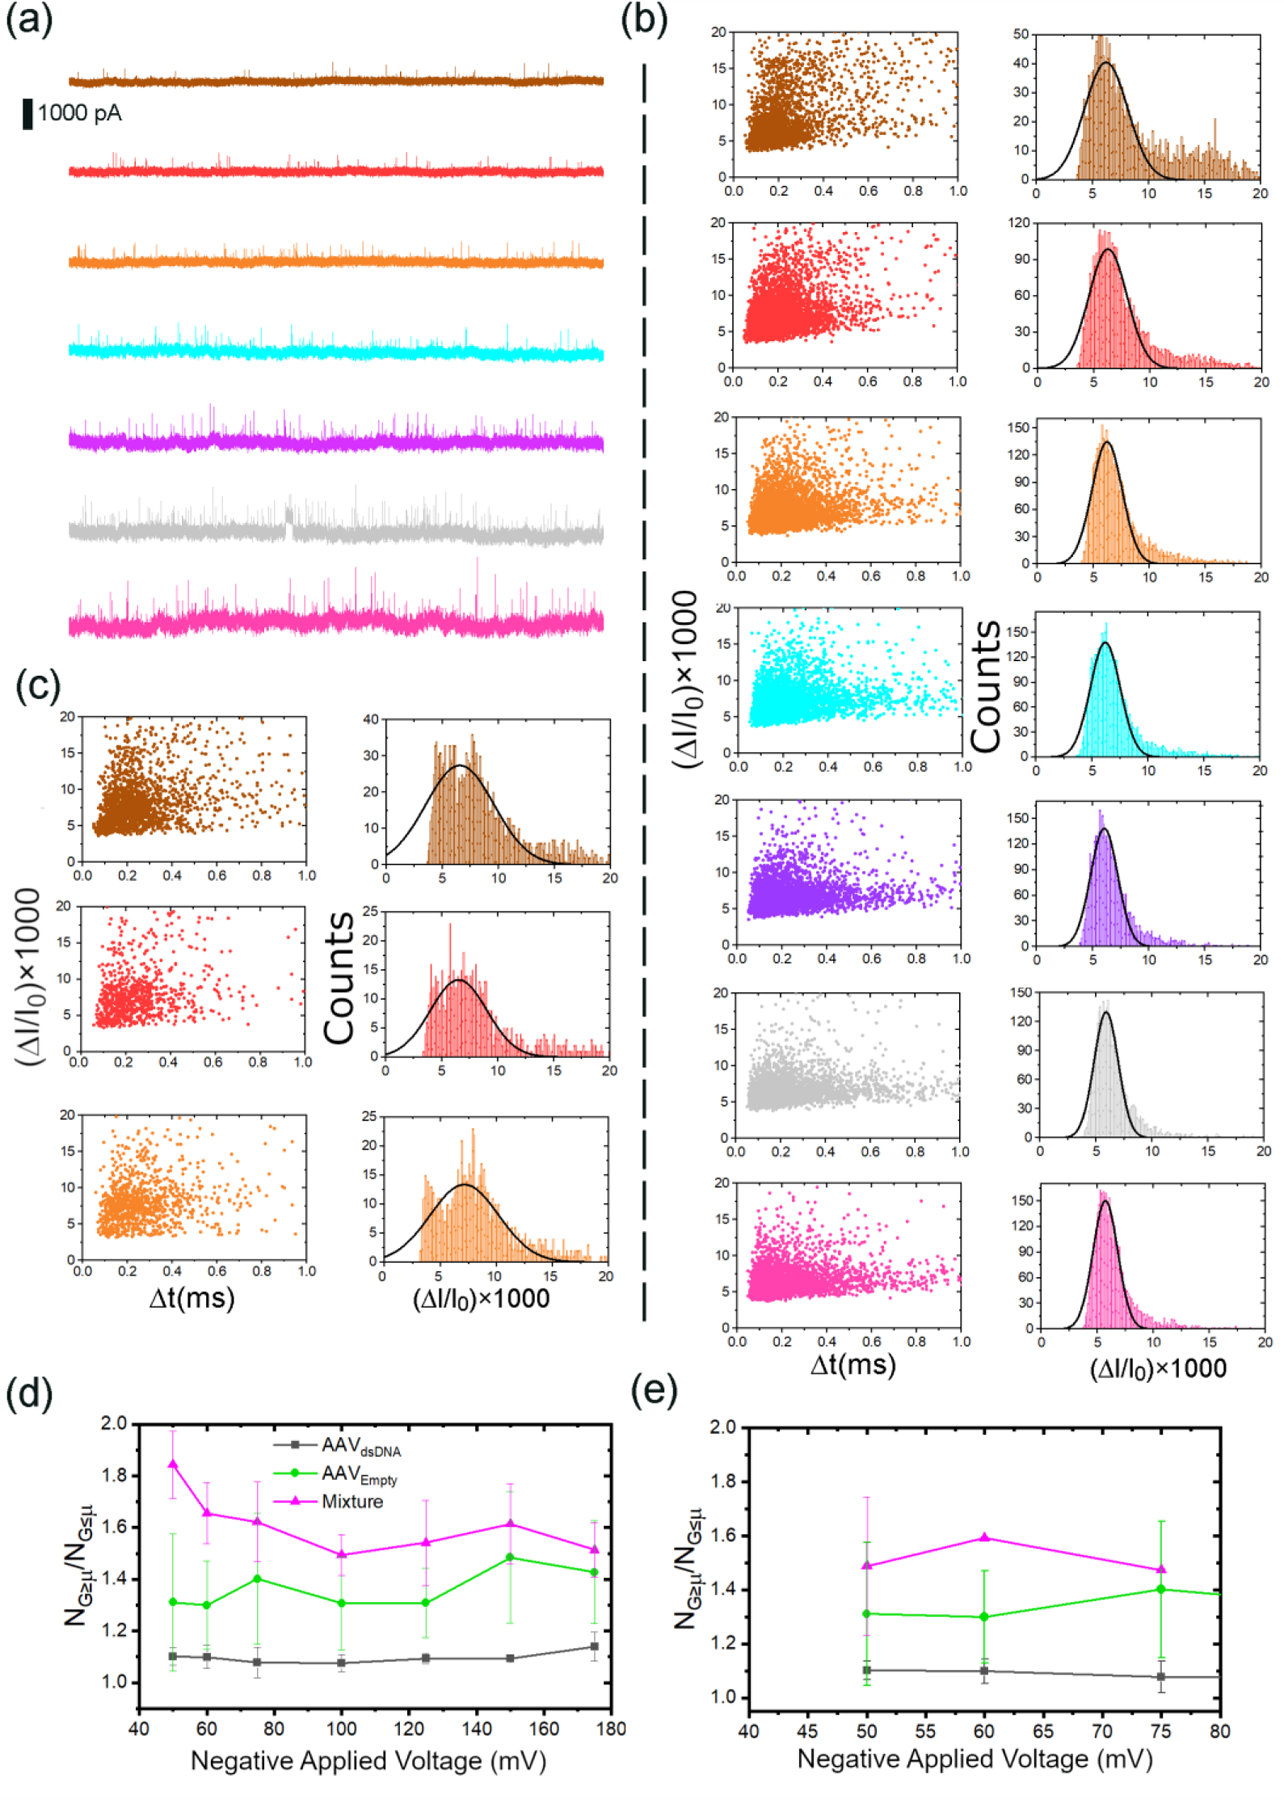
(a) 5-second representative current traces corresponding to a 75:25% molar mixture of AAVEmpty and AAVds-DNA in response to −50 mV (brown), −60 mV (red), −75 mV (orange), −100 mV (cyan), −125 mV (purple), −150 mV (gray) and −175 mV (pink). (b) The corresponding scattered plots and histograms. (c) The scattered plots and histograms of 40:60% molar mixture of AAVEmpty and AAVds-DNA in response to −50 mV, −60 mV, −75 mV. (d)-(e) The ratio of the population above and below the mean of each Gaussian fit corresponding of histograms at each applied voltage corresponding to AAVds-DNA (black), AAVempty (green) and mixtures (magenta) of (d) 75:25% and (e) 40:60% (in molar concentration) of AAVEmpty and AAVds-DNA. Each mixture was measured in duplicate using unique nanopores.
Figure 4: OriginLab 2018b, GIMP 2.10.8