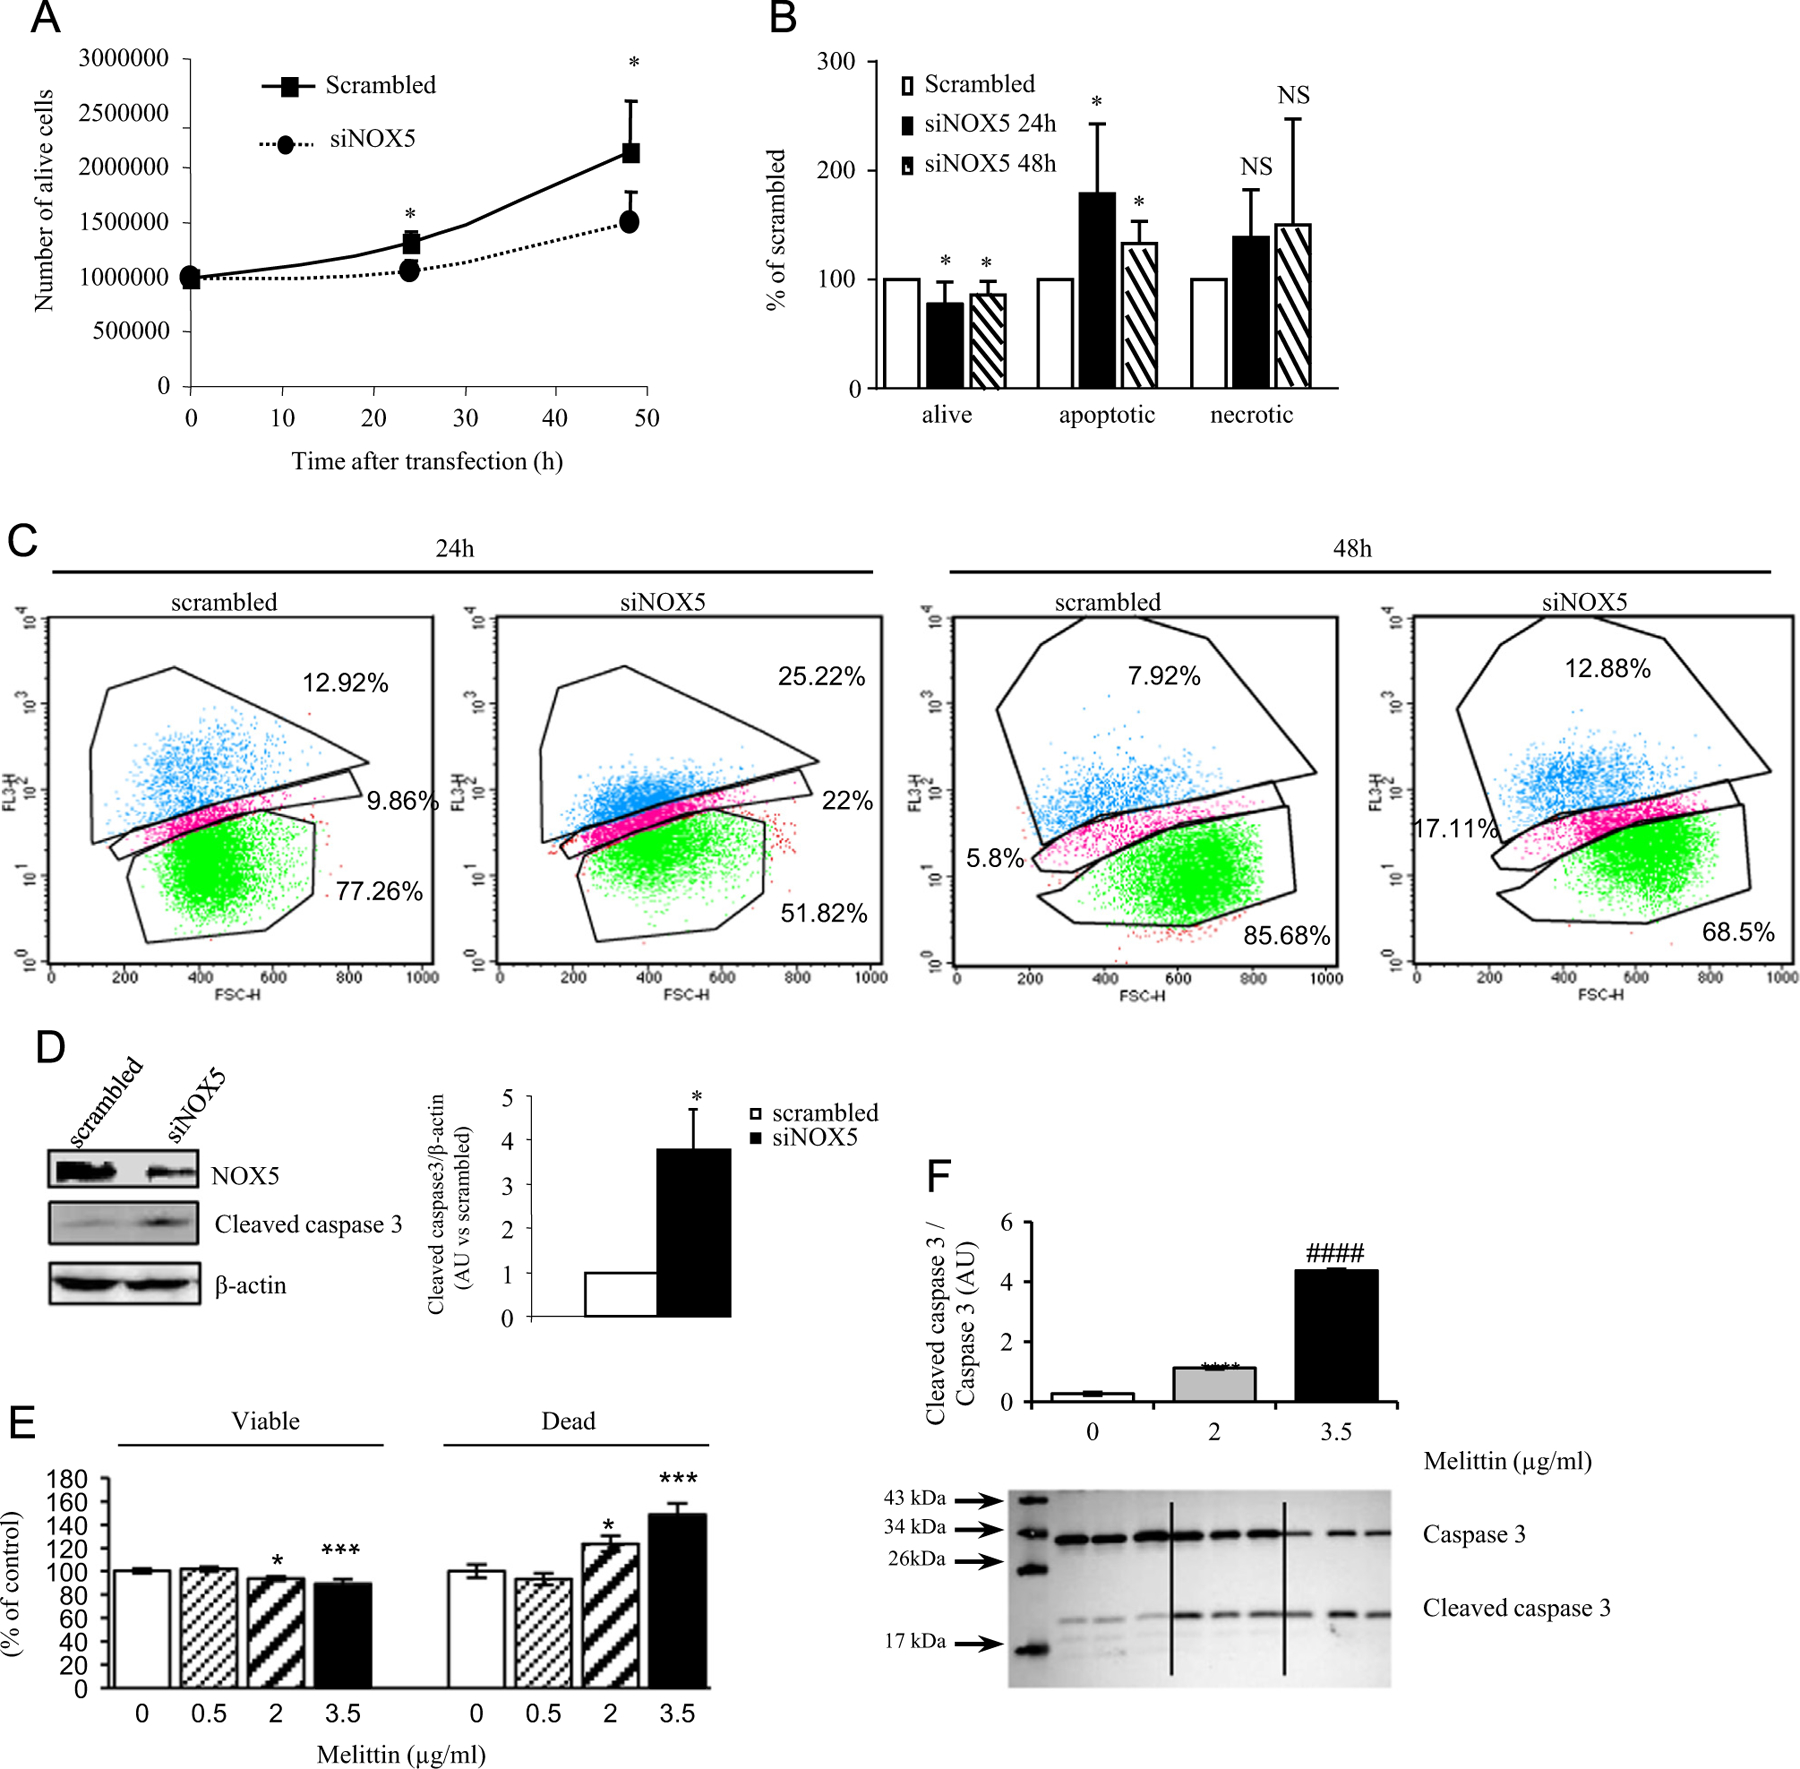
Fig. 4.

NOX5 depletion induces apoptosis. Karpas-299 cells were transfected with scrambled or NOX5-specific siRNA and were analyzed 24 and 48 h after transfection. (A) Number of live cells measured by trypan blue staining. *p < 0.05, scrambled vs siNOX5 siRNA-transfected cells; data are derived from four or five independent experiments. (B) Karpas-299 cells were stained with 7-AAD and apoptosis was determined by FACS analysis. Graph depicts live, apoptotic, and necrotic NOX5 siRNA-transfected cells expressed as a percentage of scrambled siRNA-transfected cells. Data are derived from four experiments, *p < 0.01 determined by Student’s t test. (C) Representative FACS images of 7-AAD-stained scrambled and NOX5-specific siRNA-transfected cells after 24 and 48 h of transfection. Values marked are the percentage of cells in necrotic and apoptotic phase or alive (from top to bottom). (D) Western blot detection of NOX5 and cleaved caspase 3 in scrambled or NOX5-specific siRNA-transfected Karpas-299 48 h after transfection. β-Actin was used as loading control. Graph depicts quantification of cleaved caspase 3 levels in siNOX5-transfected Karpas-299 cells relative to levels in scrambled siRNA-transfected cells. *p < 0.01 determined by Student’s t test. (E) Apoptosis upon melittin treatment. Graph depicts the live and apoptotic Karpas-299 cells determined by trypan blue exclusion upon treatment with 0.5, 2, and 3.5 μg/ml melittin after 72 h of treatment. Data are expressed as the percentage of control, DMSO-treated cells and are derived from two or three independent experiments conducted in triplicate for each condition. *p < 0.05 and ***p < 0.001, 2 and 3.5 μg/ml melittin vs DMSO-treated cells, respectively. (F) Detection and quantification of caspase 3 cleavage upon melittin treatment. Data are expressed as the mean ± SEM compared to DMSO-treated control cells. AU, arbitrary unit. ****p < 0.0001, melittin- vs DMSO-treated cells; ####p < 0.0001, 3.5 vs 2 μg/ml melittin-treated cells.
