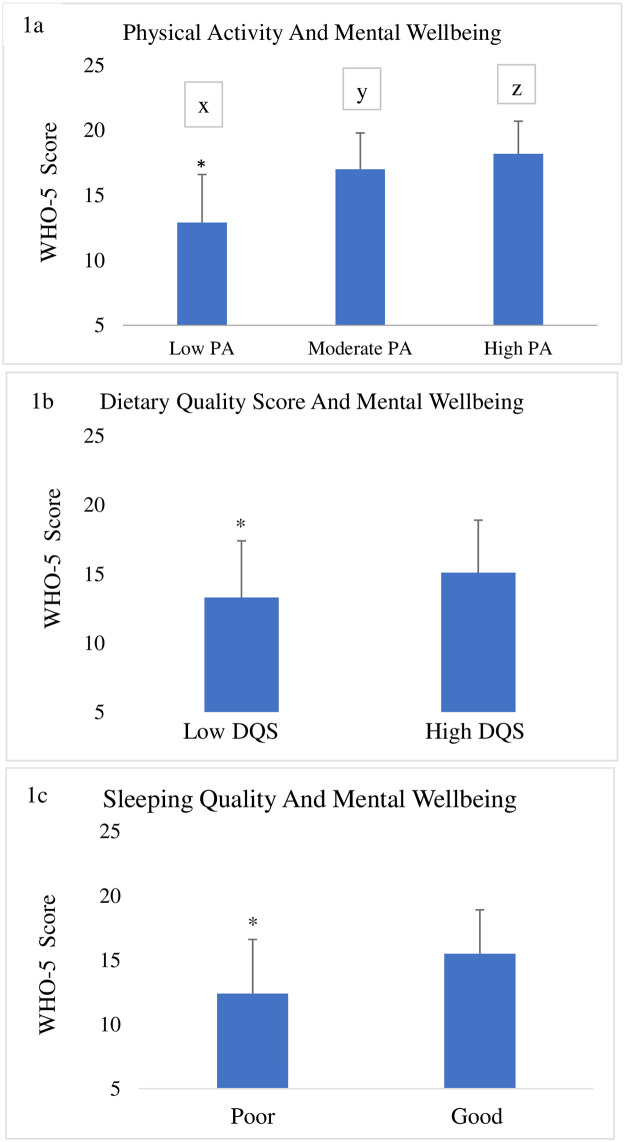
Fig 1.
a. Mental health score of participants with varied levels of physical activity (low, moderate and high). Bars with different letters are significantly different using one-way analysis of variance (ANOVA). b. Mental health score of participants with poor or good dietary quality score p˂0.001 using T-test). c. Mental health score of participants with poor or good sleep quality score.

