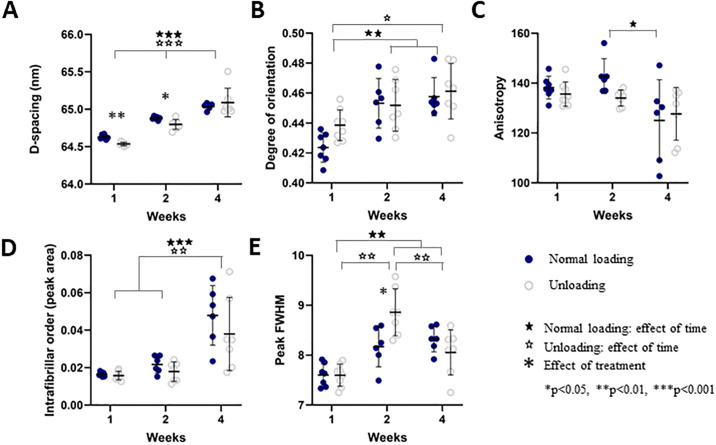
Fig 6. Quantitative SAXS data from the callus region.
Properties are shown for loaded and unloaded samples after 1, 2 and 4 weeks of healing, displaying A) D-spacing (nm), B) Degree of orientation (AU), C) anisotropy (degrees), D) intrafibrillar order (AU) and E) peak FWHM (nm). Individual data points, as well as mean and standard deviation are shown in the graphs.

