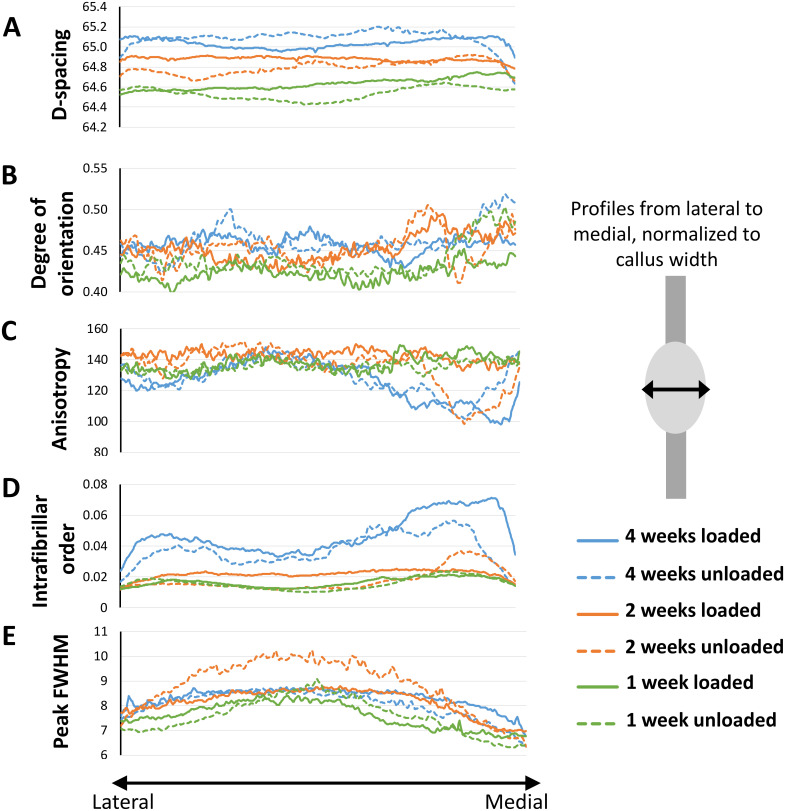
Fig 7. Spatial profiles of the SAXS data.
Properties are shown from the lateral (left) to the medial (right) side of the callus for loaded and unloaded samples after 1, 2 and 4 weeks of healing, displaying A) D-spacing (nm), B) Degree of orientation (AU), C) anisotropy (degrees), D) intrafibrillar order (AU) and E) peak FWHM (nm). Average profiles of all samples per group are shown.

