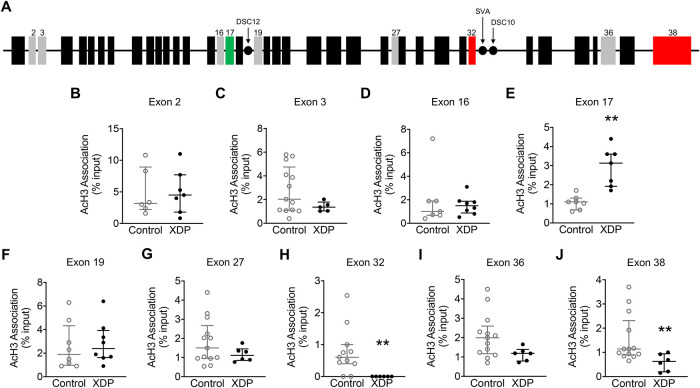
Fig 4. Acetylated histone H3 association with TAF1 gene exons in XDP-derived fibroblasts.
Graphs demonstrate AcH3 association with TAF1 exons measured by ChIP-qPCR, displayed as individual values from control- (n = 14) and XDP-derived fibroblasts (n = 7), with the central line representing the median, and the edges representing the interquartile range, respectively. (A) Schematic representation of TAF1 gene. Black boxes represent TAF1 exons; gray boxes represent exons assessed in this study; green boxes represent increased AcH3 association; red boxes represent decreased AcH3 association; black dots represent the disease-specific variants (DSCs) assessed in this study. (B) AcH3 association with exon 2 (Mann-Whitney U = 19, p = 0.8357). (C) AcH3 association with exon 3 (Mann-Whitney U = 18.50, p = 0.1810) (D) AcH3 association with exon 16 (Mann-Whitney U = 25, p = 0.7782) (E) AcH3 association with exon 17 (Mann-Whitney U = 0.5000, p = 0.0012). (F) AcH3 association with exon 19 (Mann-Whitney U = 25.50, p = 0.5220). (G) AcH3 association with exon 27 (Mann-Whitney U = 25, p = 0.2441). (H) AcH3 association with exon 32 (Mann-Whitney U = 6, p = 0.0041). (I) AcH3 association with exon 36 (Mann-Whitney U = 17, p = 0.0577). (J) AcH3 association with exon 38 (Mann-Whitney U = 10, p = 0.0087). ** p < 0.01.

