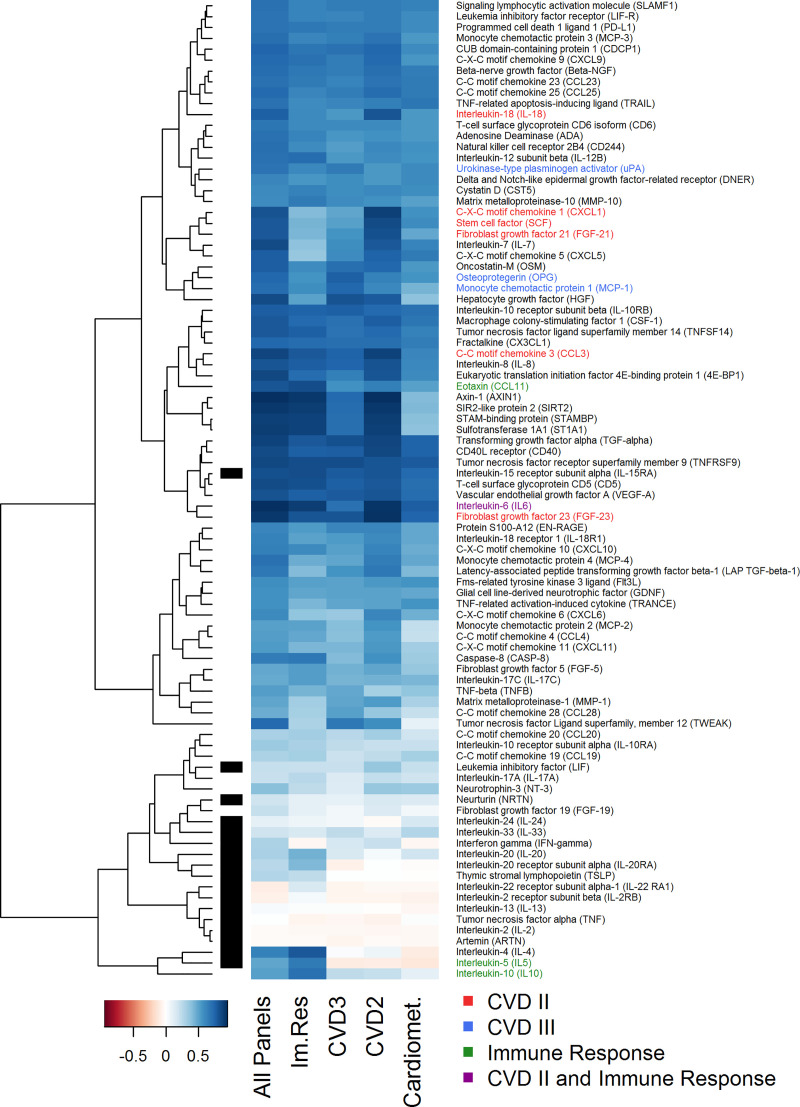
Fig 3. Imputation accuracy depends on utilized protein panels.
Pearson correlations between imputed (missForest) versus remeasured values for 91 proteins, comparing the use of different protein panels for imputation (all 5 panels versus Inflammation and one additional panel). Black bars mark proteins with more than 25% of values below LOD. Colored protein names mark proteins with duplicate measurement (red: CVD II and Inflammation; blue: CVD III and Inflammation; green: Immune Response (Im. Res) and Inflammation) or triplicate measurement (violet: CVD II, Immune Response, and Inflammation). Im. Res: Immune Response.

