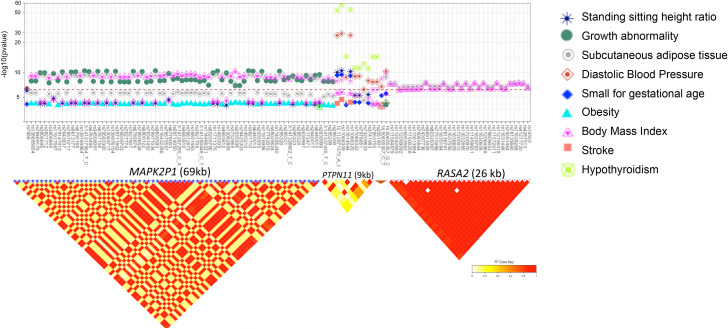
Fig 4. PheWAS result and linkage plot for variants with pleiotropy in RAS-opathy genes.
Associations between variants with pleiotropic effects in MAP2K1, PTPN11, SOS2 and RASA2, and HPO terms (a) and linkage between the variants (b). The red line represents the level of significance after Bonferroni correction (p = 2.7x10-07).

