Figure 5.
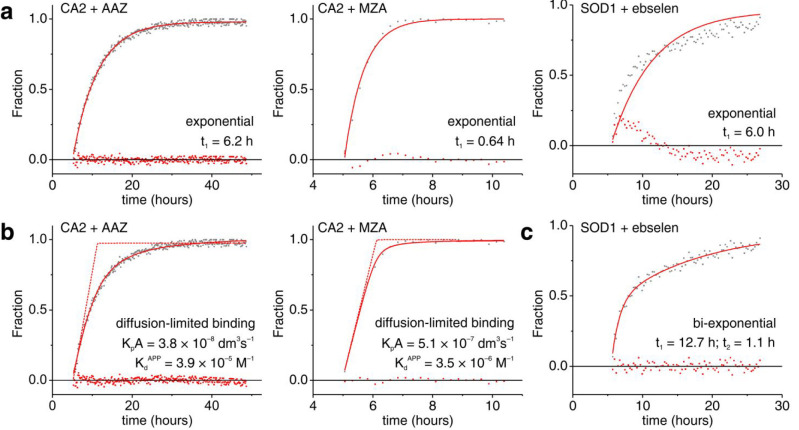
Nonlinear curve fitting of real-time NMR data. (a) Fraction of CA2 bound to AAZ (left) and MZA (center), and disulfide-oxidized SOD1 (right) fitted with single exponential build-up curves. (b) Fraction of CA2 bound to AAZ (left) and MZA (right) fitted with a membrane diffusion-limited model.16 (c) Fraction of disulfide-oxidized SOD1 fitted with a biexponential build-up curve. The exponential time constants (t1, t2), the permeability coefficients × membrane area (KpA) and the apparent dissociation constants (KdAPP) are reported in each panel. Raw data and residuals are shown as gray and red dots, respectively. Best-fit curves are shown as continuous red lines. In (b), diffusion-limited binding curves with values of KdAPP fixed to the KI determined in vitro (KIAAZ = 12 × 10–9 M; KIMZA = 14 × 10–9 M) are shown as dashed red lines.

