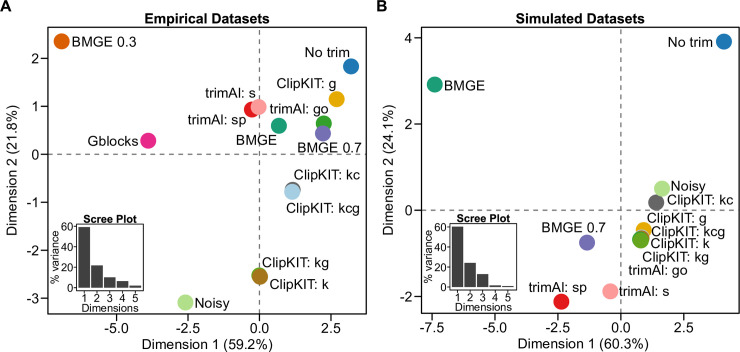
Fig 1. The 14 alignment trimming strategies tested differ in resulting MSAs and metrics of phylogenetic tree accuracy and support.
Principal component analysis of alignment length, nRF, and ABS values across the 14 MSA trimming strategies for 4 empirical datasets (A) and 4 simulated datasets (B). Insets of scree plots depict the percentage of variation explained (y-axis) for the first 5 dimensions (x-axis). Data were scaled prior to conducting principal component analysis. Note that the BMGE 0.3 and Gblocks strategies are not represented in Fig 1B because they frequently removed entire alignments and were therefore removed from the analysis of simulated sequenced. Data used to generate this figure can be found on figshare (doi: 10.6084/m9.figshare.12401618). ABS, average bipartition support; BMGE, Block Mapping and Gathering with Entropy; MSA, multiple sequence alignment; nRF, normalized Robinson–Foulds.

