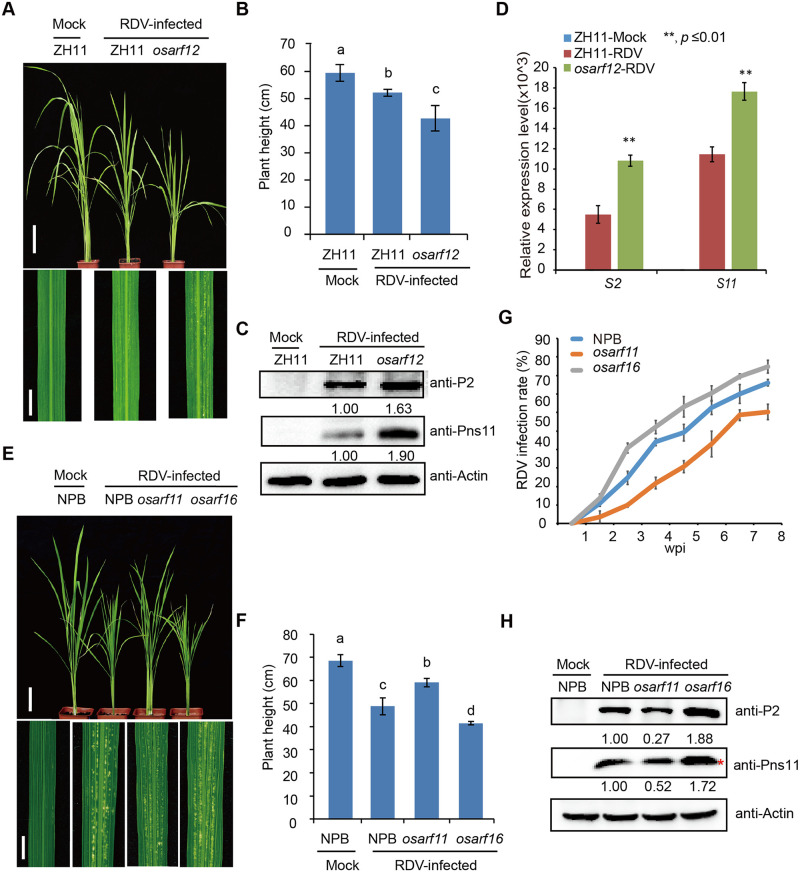
Fig 3. Loss-of-function mutants of osarf12 or osarf16 exhibit reduced resistance whereas osarf11 mutants display enhanced resistance to RDV.
(A) Phenotypes of RDV-infected WT (ZH11) and osarf12 mutants. Photos were taken at 4 weeks after RDV-inoculation. The sizes of white specks on the leaves represent the degree of disease symptoms. Scale bars, 10 cm (upper panel) and 1 cm (lower panel). (B) Schematic representation of plant height for the plants in (A). The average (±SD) values were obtained from three biological repeats. Different letters indicate significant difference (p< 0.05) based on the Tukey-Kramer HSD test. (C) Accumulation of RDV proteins in the corresponding lines. Actin was used as a loading control for proteins. (D) Accumulation of RDV RNAs in the corresponding lines. The average (±SD) values were obtained from three biological repeats. The error bars indicate SD. (E) Phenotypes of RDV-infected WT (NPB), osarf11 and osarf16 mutants. Photos were taken at 4 weeks after RDV-inoculation. The sizes of white specks on the leaves represent the degree of disease symptoms. Scale bars, 10 cm (upper panel) and 1 cm (lower panel). (F) Schematic representation of plant height for the plants in (E). The average (±SD) values were obtained from three biological repeats. Different letters indicate significant difference (p< 0.05) based on the Tukey-Kramer HSD test. (G) RDV infection rates of osarf11, osarf16 and WT (NPB) from one wpi to eight wpi. Inoculation assays were repeated three times. The error bars indicate SD. (H) Accumulation of RDV proteins in the corresponding lines. Actin was used as a loading control for proteins. “*” indicated the RDV Pns11 protein.

