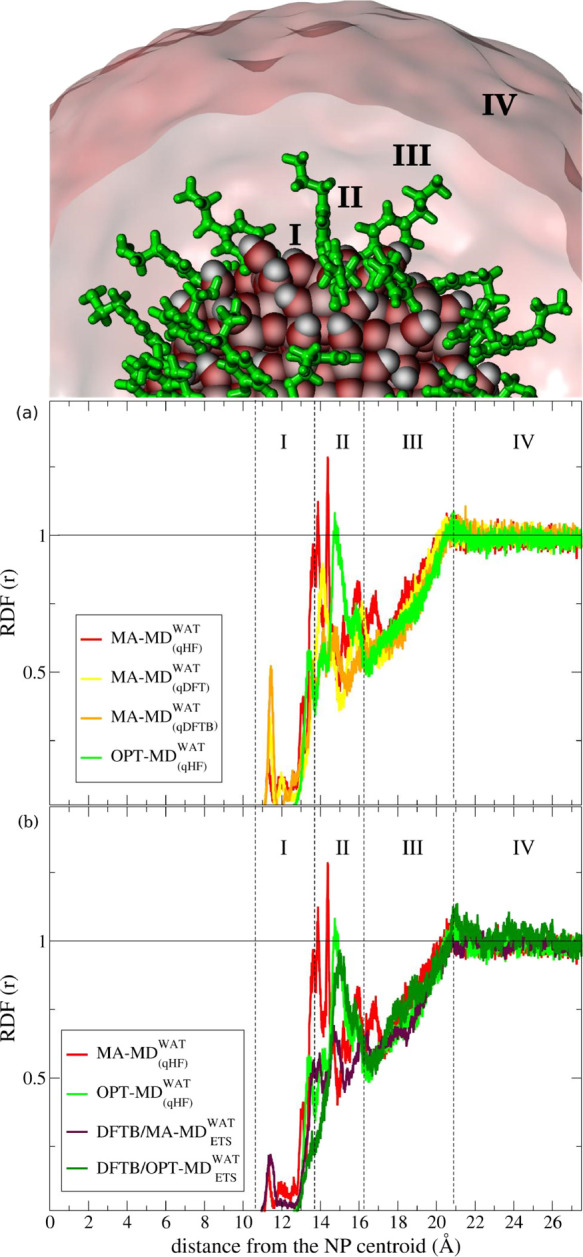
Figure 2.

Normalized RDF profiles of water as a function of distance from the NP centroid and their regions of interest numbered with roman numbers from I to IV. The outermost surface Ti atoms are at a distance of 12.2 Å from the NP centroid. The dotted-black vertical lines were traced to define each region of interest in the RDF profile. The horizontal black line is traced at the RDF unit corresponding to the ideal density of bulk water. The subscript ETS stands for starting-point structures provided by the ETS protocol for DFTB/MM-MD simulations. The level of theory used to derive the partial-atomic charges of the DOP ligands for classical simulations are indicated in parentheses. RDF profiles of MM-MD and QM/MM-MD simulations are sketched as follows: MA – MD(qHF)WAT (red), MA – MD(qDFT) (yellow), MA – MD(qDFTB)WAT (orange), OPT – MD(qHF) (light green), DFTB/MA – MDETSWAT (dark violet), and DFTB/OPT – MDETS (dark green). Zoomed images illustrating the binding modes of dopamine and its interaction with water are reported in Figure S2.
