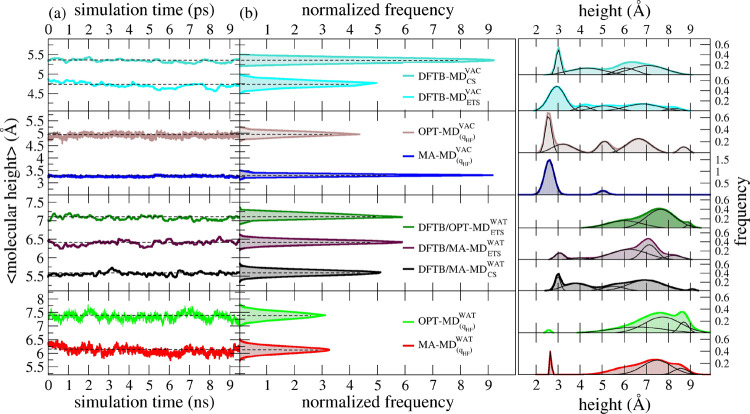
Figure 3.
(a) Time evolution of the molecular height of surface-bonded DOP and (b) corresponding normalized distribution from time-averaged values of DFTB/MD, DFTB/MM-MD, and classical MM-MD simulations. (c) Nonlinear curve fitting and deconvolution analysis of nonaveraged values of the molecular height of surface-bonded DOP. Black curves represent the deconvolution of their respective nonlinear fitted curves. The level of the theory of the point-charge model used in MM-MD simulations is reported in parentheses. The subscripts VAC and WAT stand for simulations under vacuum and aqueous solvation, respectively. Time units are in picosecond and nanosecond for QM/MM-MD (top) and classical MM-MD simulations (bottom) in their respective x-axis. The simulation methods are distinguished here by the following color scheme: turquoise for DFTB/MD simulations in vacuum; cyan for DFTB/MD simulations using ETS restart in the vacuum medium; black for DFTB/MA-MD simulations with the MA-FF LJ (12-6) parameters in water solvation; dark violet for DFTB/MA-MD simulations with the MA-FF LJ (12-6) parameters using ETS restart in water solvation; dark green for DFTB/OPT-MD simulation with the OPT-FF LJ (12-6) parameters using ETS restart. CS stands for conventional sampling where the starting-point structure for the QM/MM simulations is taken from the optimized structure at the DFTB level and then solvated by molecular packing of water molecules

