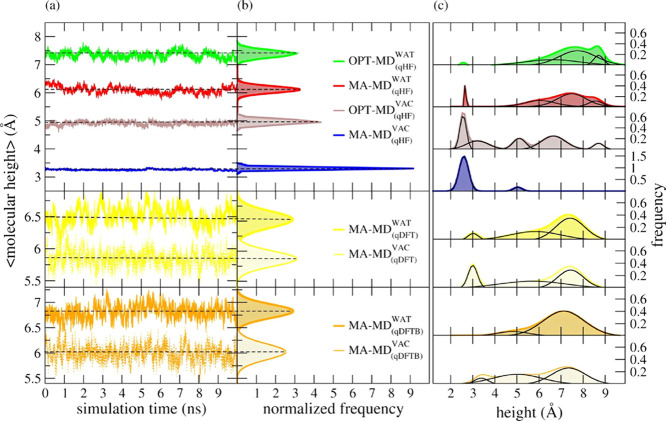
Figure 4.
(a) Time evolution of the molecular height of surface-bonded DOP and (b) corresponding normalized probability distribution profiles obtained through classical MD simulations with the original Matsui–Akaogi force field (MA-FF) and its ad hoc optimized set of parameters (OPT-FF). (c) Nonlinear curve fitting and deconvolution analysis of instantaneous values of the molecular height of surface-bound DOP. Black curves represent the deconvolution of their respective nonlinear fitted curves. The level of theory used to fit the point-charge model of DOP is indicated in parentheses. The subscripts VAC and WAT stand for MD simulations under vacuum and aqueous solvation, respectively. The color scheme adopted here is consistent with the one adopted in Figure 2. MD simulations in vacuum were sketched with a lighter color

