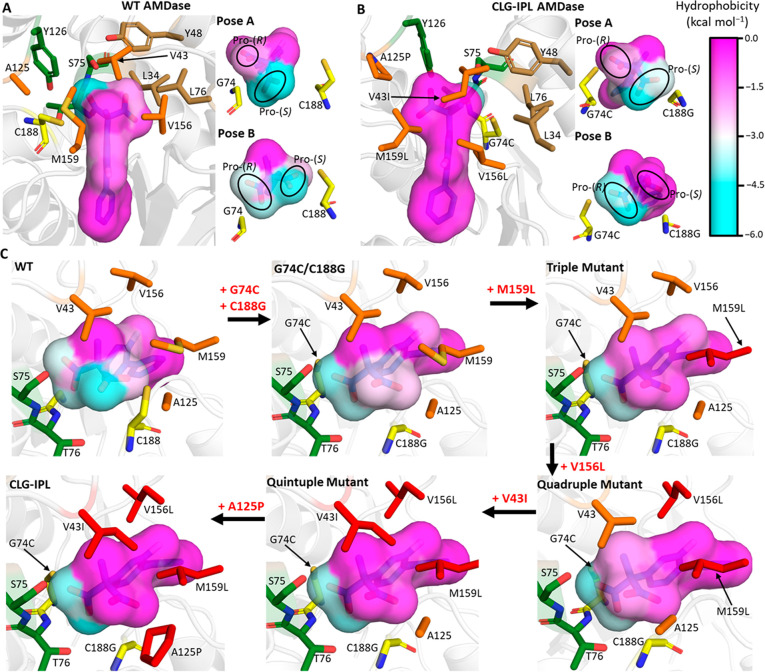
Figure 8.
Projection of the local active site hydrophobicity onto the two potentially reactive binding poses for (A) wild-type AMDase and (B) the CLG-IPL variant. For both enzyme variants, the local hydrophobicity surrounding each atom of compound 1b is colored according to the scale on the right-hand side, with more negative values indicating a more hydrophilic environment for that atom. For both variants, an overview picture is shown with the catalytic residues colored yellow, the oxyanion hole residues colored green, the (original) hydrophobic pocket residues colored brown, and residues in orange denoting those substituted to obtain the CLG-IPL variant. The smaller pictures associated with both variants describe the local hydrophobicity for either potentially reactive binding mode, with the pro-(R) and pro-(S) carboxylate groups labeled throughout. (C) Progressive construction of the second hydrophobic pocket to allow AMDase activity through binding Pose B. Each enzyme is shown in binding Pose B and colored as described in panels A and B, with the exception that point mutations accumulated along the pathway from G74C/C188G are progressively recolored from orange to red. Calculation and projection of the active site hydrophobicities onto each ligand atom was performed by determining the solvation free energy with GIST41,60 and then using the mapping procedure described in ref (61). Equivalent projections as in panels (A) and (B) are provided in Figure S19 for the G74C/C188G and G74C/C188A AMDase variants.

