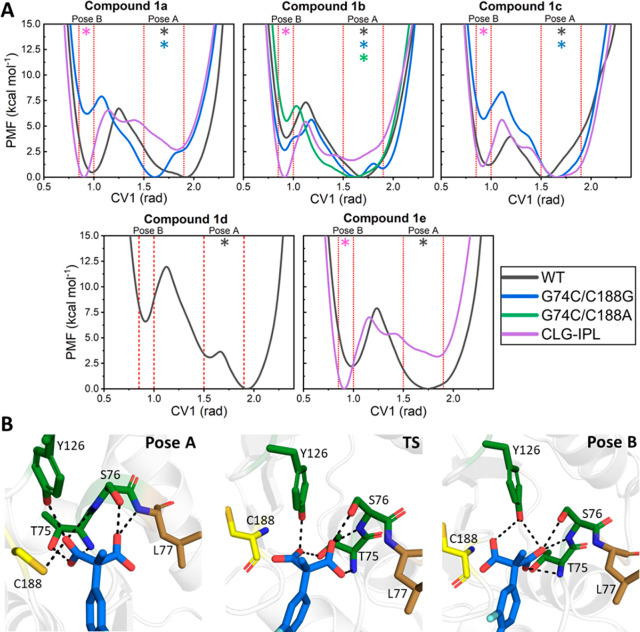
Figure 9.
(A) Free energy profiles describing the relative populations of either binding Pose A or B (Figure S7) for the same combinations of substrates and enzymes as used in our EVB simulations (Table 1). The catalytically preferred binding pose, based on the calculated activation free energies from our EVB simulations, is denoted with a * [colored to match the line color for each enzyme variant, as shown in the color key of panel (A)]. Profiles were obtained using well-tempered metadynamics (WT-MetaD) simulations with a single collective variable (CV1) used to describe the relative orientation of both carboxylate groups of the substrate in the active site. The approximate regions of both binding poses are indicated on each graph. (B) Representative structures (obtained from clustering, see the SI Methodology) of both binding poses and the approximate transition state (TS) between them for wild-type AMDase in complex with compound 1b. Hydrogen-bonding interactions between the substrate and oxyanion hole residues are indicated by dashed lines.

