
Figure 10.
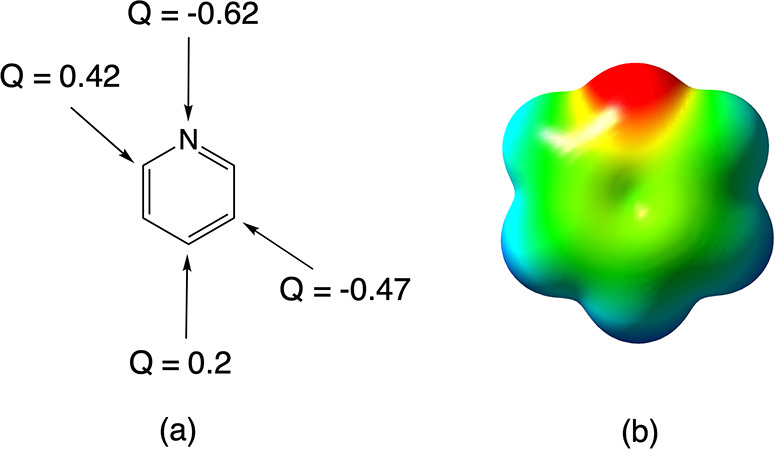
(a) ESP charges (Q) on the different potential protonation sites of pyridine. (b) Corresponding MEP maps (scale ranges from −25 (red) to 25 kcal/mol (blue)).
Official websites use .gov
A
.gov website belongs to an official
government organization in the United States.
Secure .gov websites use HTTPS
A lock (
) or https:// means you've safely
connected to the .gov website. Share sensitive
information only on official, secure websites.
(a) ESP charges (Q) on the different potential protonation sites of pyridine. (b) Corresponding MEP maps (scale ranges from −25 (red) to 25 kcal/mol (blue)).