
Figure 2.
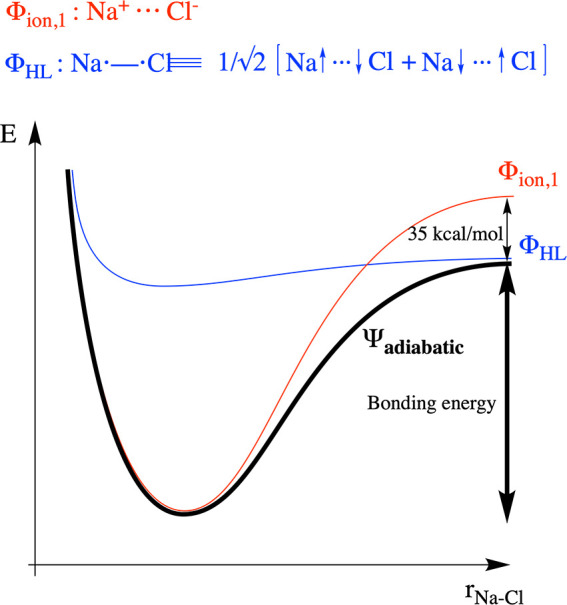
Profile of the bonding interaction and the evolution of energy of the individual diabatic curves and the global adiabatic state associated with this process for NaCl. Note that the diabatic curves associated with the Heitler–London structure (blue) does not contribute significantly to the black adiabatic curve in the region around the optimal bonding distance: the latter curve coincides with the main ionic structure. Note also that the curve associated with Φion,2 is not depicted in this figure due to significant energy gap between this curve and those associated with Φion,1 and ΦHL, respectively.