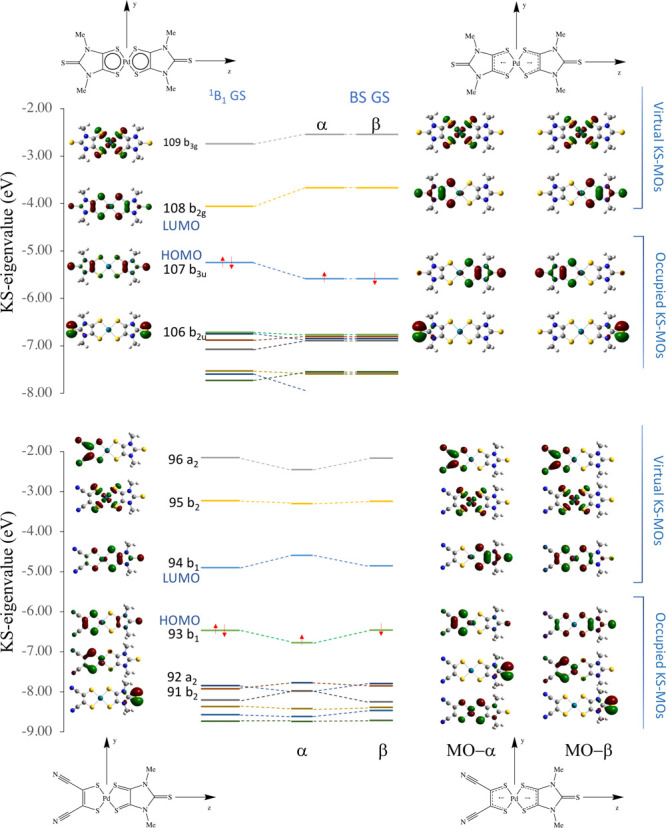
Figure 5.

Frontier KS-MO energy diagram (−2 to −8 eV) showing the energy and MO drawing in the restricted (CS GS, left) and singlet diradical (BS GS, right) descriptions for 1 (top) and 3 (bottom). Cutoff value: 0.05 |e|.

Frontier KS-MO energy diagram (−2 to −8 eV) showing the energy and MO drawing in the restricted (CS GS, left) and singlet diradical (BS GS, right) descriptions for 1 (top) and 3 (bottom). Cutoff value: 0.05 |e|.