Figure 6.

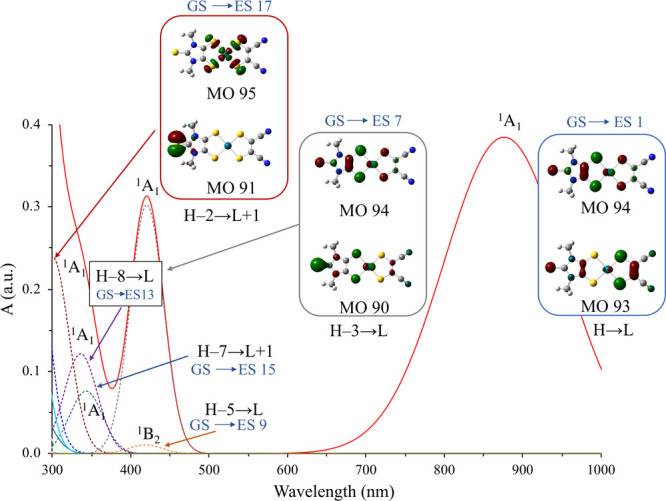
UV–vis–NIR spectrum of 3 simulated on the basis of IEF-PCM TD-RDFT calculations in CHCl3. FWHM w = 90 nm for the 1A1 (H → L) transition, and w = 25 nm for the UV–vis bands. Cutoff value: 0.05 |e|.

UV–vis–NIR spectrum of 3 simulated on the basis of IEF-PCM TD-RDFT calculations in CHCl3. FWHM w = 90 nm for the 1A1 (H → L) transition, and w = 25 nm for the UV–vis bands. Cutoff value: 0.05 |e|.