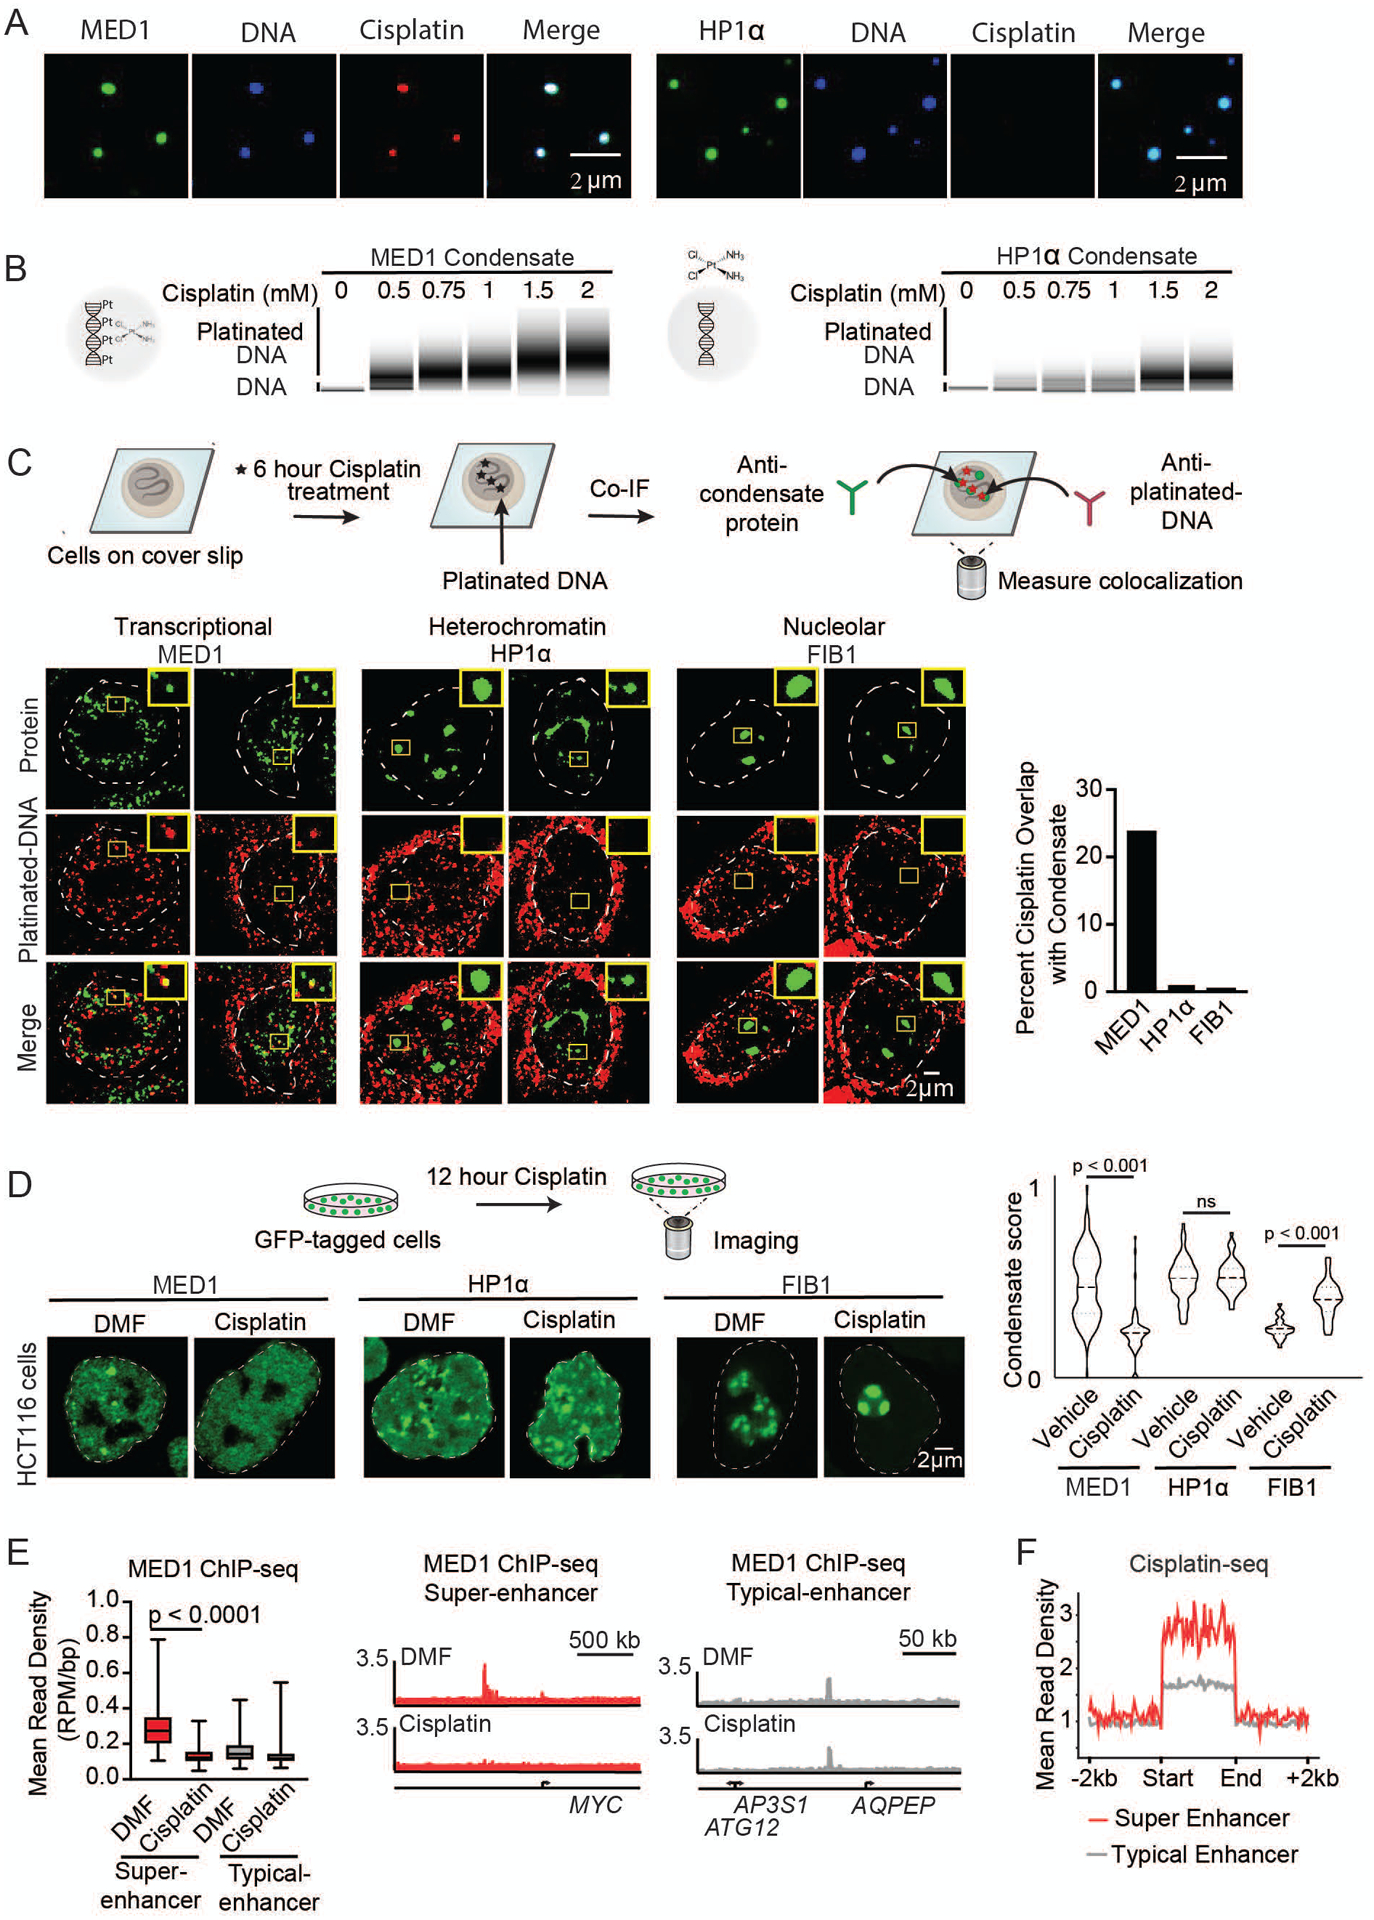
Fig. 3.

Small molecule concentration within condensates influences drug activity. (A) In vitro droplet assay of MED1 and HP1α condensates formed in 125mM NaCl and 10% PEG, 5nM of 450bp DNA, 10μM MED1, and 5μM cisplatin-TR, imaged at 150× on a confocal fluorescent microscope (see also Figure S15). (B) Bioanalyzer tracings of DNA contained within either MED1 or HP1α droplets exposed to the indicated concentration of cisplatin. (C) (Top) Schematic of an assay to determine the location of platinated DNA relative to various nuclear condensates. (Bottom) Co-immunofluorescence of platinated DNA and the indicated protein in HCT116 cells treated with 50μM cisplatin for 6 hours. Imaged at 100× on a confocal fluorescent microscope. Quantification of overlap shown to the right. (D) (Top) Schematic of a live cell condensate dissolution assay. (Bottom) HCT116 cells bearing endogenously mEGFP-tagged MED1, HP1α, or FIB1 treated with 50μM cisplatin for 12 hours. Quantification of MED1, HP1α, or FIB1 condensate score is shown to the right. (E) MED1 ChIP-seq in HCT116 cells treated with vehicle or 50μM cisplatin for 6 hours. (Left) Plotted are mean read density of MED1 at super-enhancers and typical-enhancers (error bars show min and max) and (Right) gene tracks of MED1 ChIP-Seq at the MYC super-enhancer and AQPEP typical-enhancer. (F) Metaplot of cisplatin-DNA-Seq in cisplatin treated Hela cells comparing super-enhancers and typical enhancers (41) (see also Figures S16–S21).
