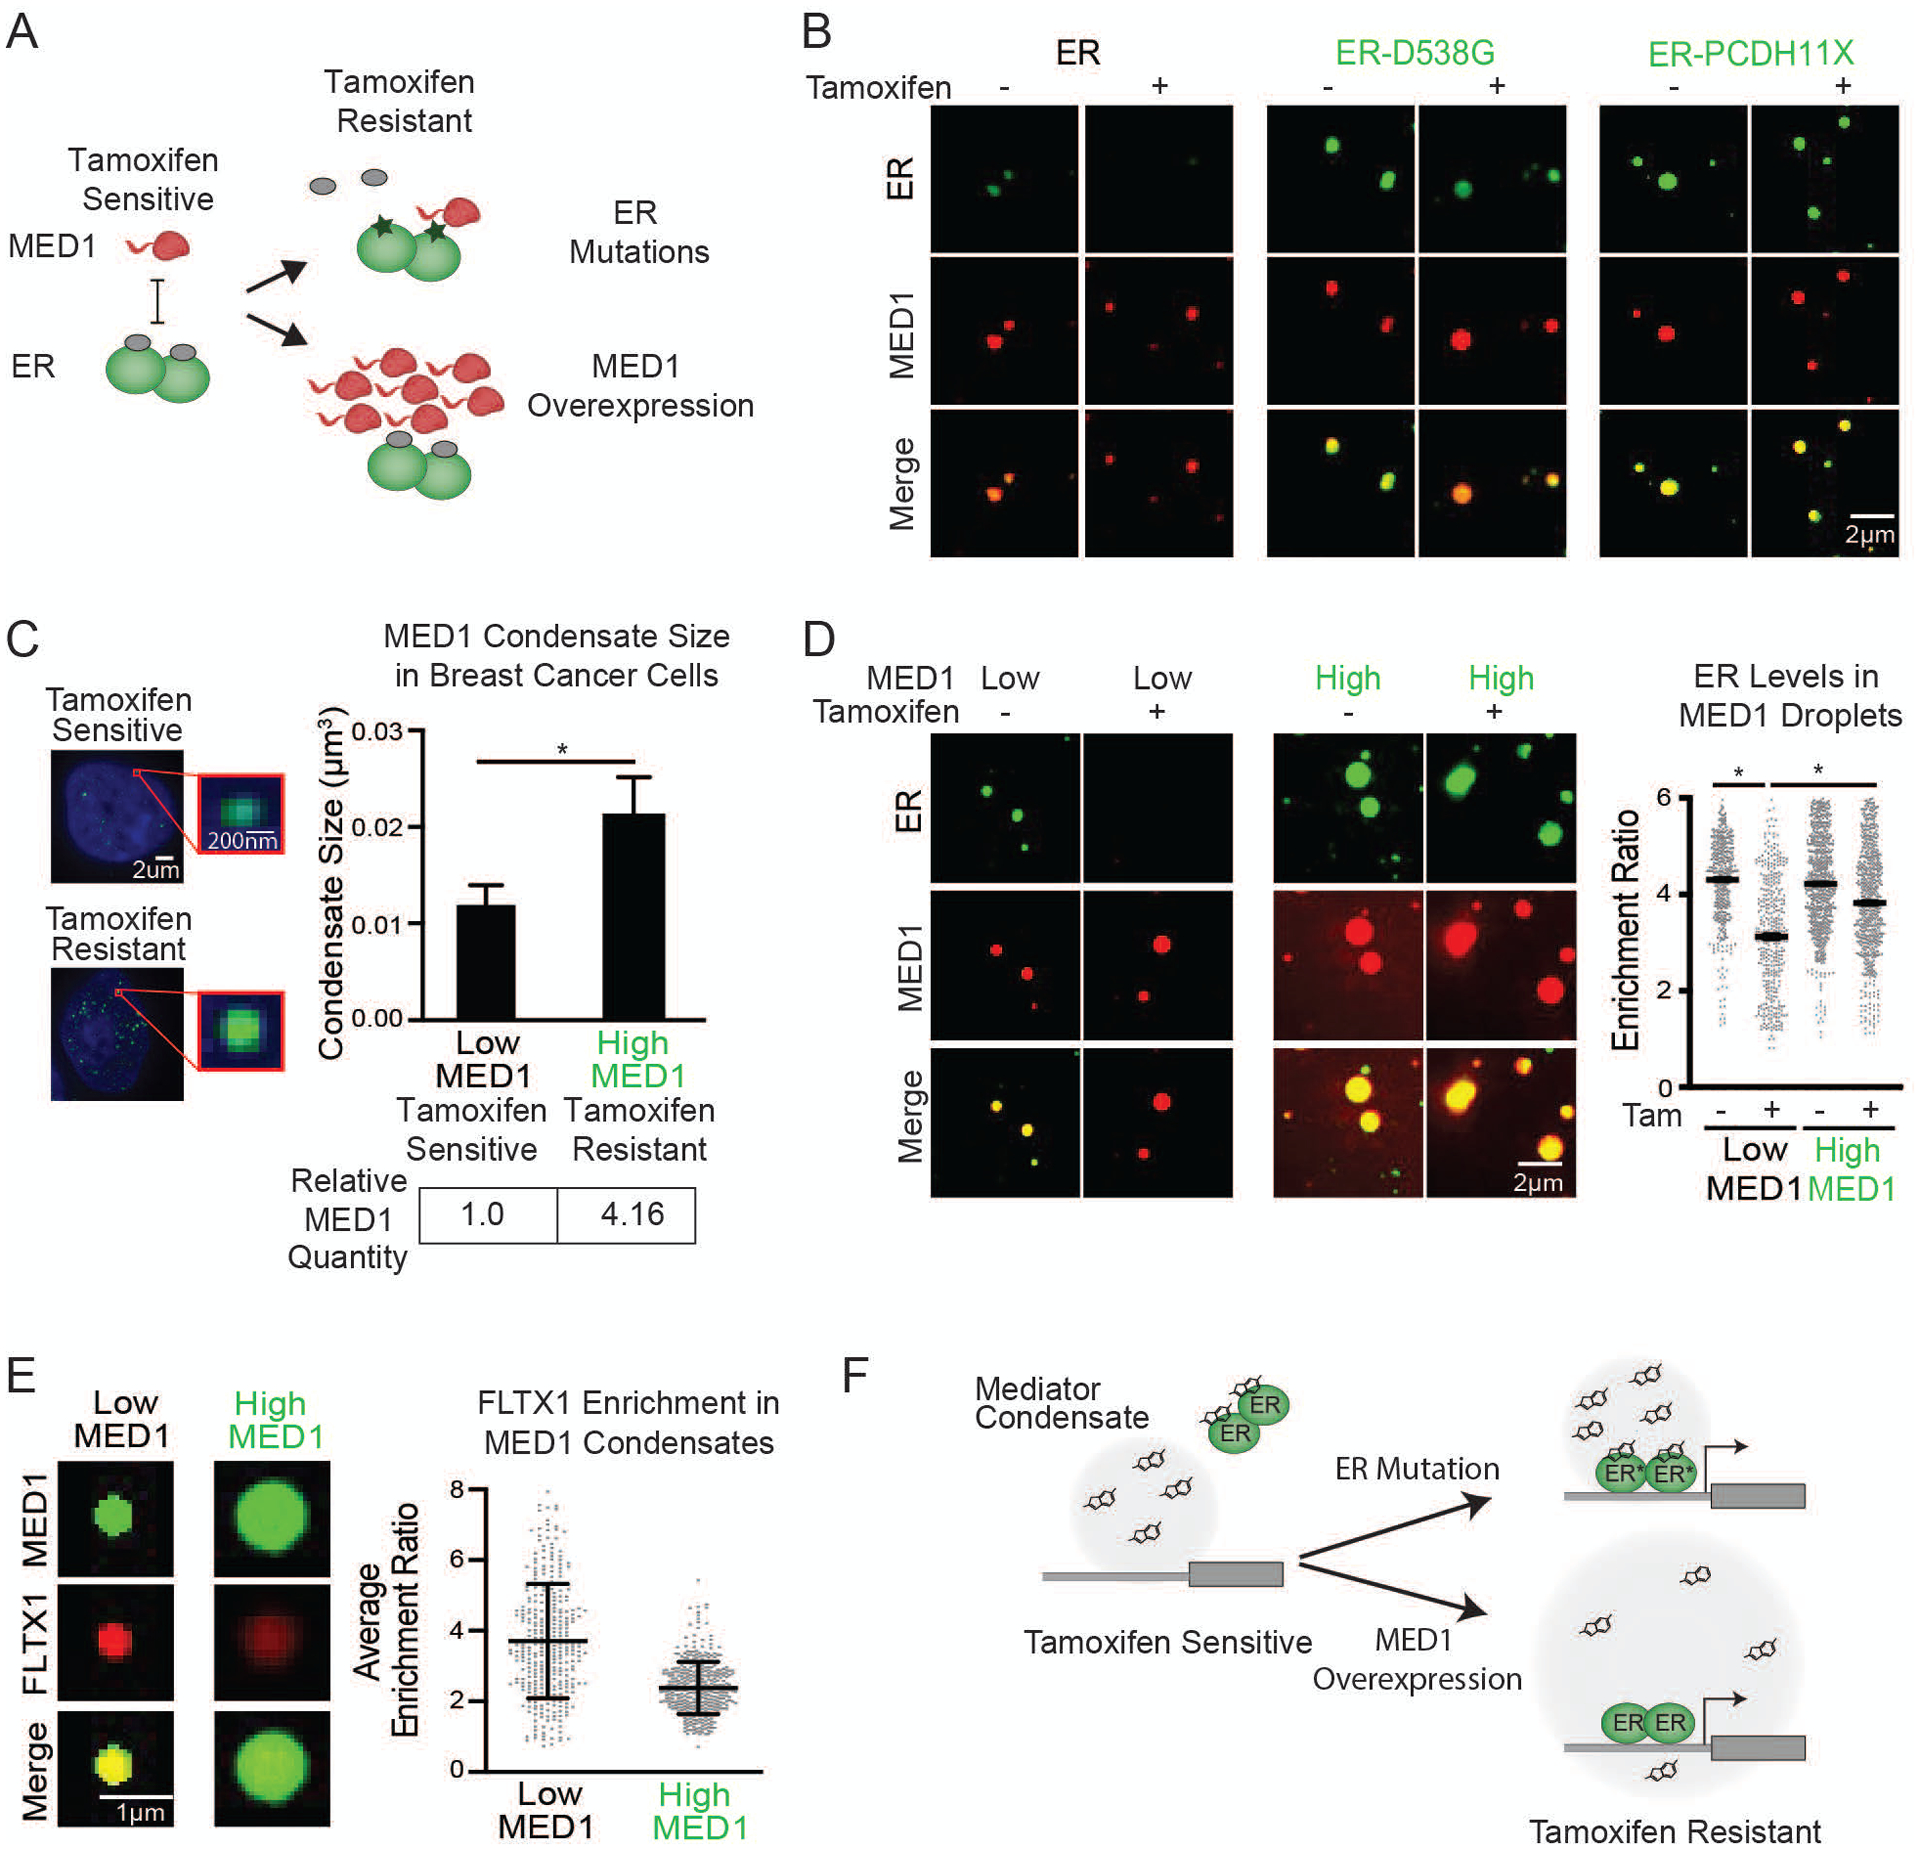
Fig. 4.

Tamoxifen action and resistance in MED1 condensates. (A) Schematic showing tamoxifen resistance by ER mutation and MED1 overexpression in breast cancer. (B) In vitro droplets assay of the indicated form of GFP-tagged ER in the presence of estrogen, +/− 100μM tamoxifen. Droplets are formed in 125mM NaCl and 10% PEG with 10μM each protein and 100μM estrogen. (C) (Left) Immunofluorescence of MED1 in tamoxifen sensitive (MCF7) and resistant (TAMR7) ER+ breast cancer cell lines imaged at 100× on a confocal fluorescent microscope. (Top right) Quantification of MED1 condensate size in breast cancer cells. (Bottom right) Relative quantities of MED1 in the indicated breast cancer cell line by western blot, error bars show SEM. (D) In vitro droplets assays of ER in the presence of 100μM estrogen, +/− 100μM tamoxifen with either 5μM (Low) or 20μM (High) MED1. Droplets are formed with 5μM ER in 125mM NaCl and 10% PEG, imaged at 150× on a confocal fluorescent microscope, error bars are SEM. (E) In vitro droplet assay with either 5μM (Low) or 20μM (High) MED1 with 100μM FLTX1 in 125mM NaCl and 10% PEG, error bars are SD. (F) Models for tamoxifen resistance due to altered drug affinity (via ER mutation) or concentration (via MED1 overexpression) (see also Figures S22–S30).
