Figure 1.
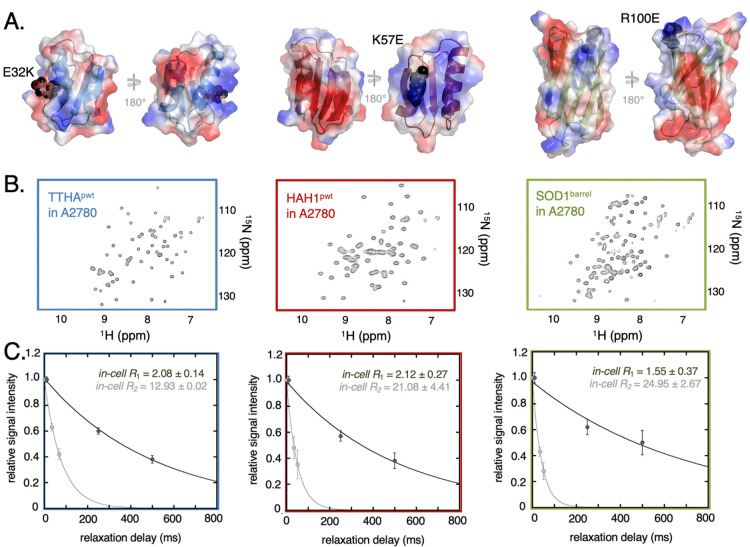
Probe proteins in-cell NMR properties and relaxation. (A) shows the proteins TTHApwt (blue), HAH1pwt (red), and SOD1barrel (green) including secondary structure elements. The electrostatic surface of each protein is displayed, with blue-colored patches belonging to the basic, positively charged residues arginine or lysine and the red colored patches belonging to the acidic, negatively charged residues glutamate or aspartate. The surface charge mutations are highlighted as black spheres. (B) depicts HMQC spectra of the reporter protein electroporated into live A2780 cells. (C) In-cell NMR relaxation data of the three basis reporter proteins are shown. Signal intensity attenuation obtained from the R1 (dark gray) and R2 (light gray) experiments are shown as filled circles and the corresponding fitted single exponential fits are shown as solid lines. The error bars in the relaxation rates are estimated from the signal-to-noise-ratio in each experiment (Supporting Information Methods).

