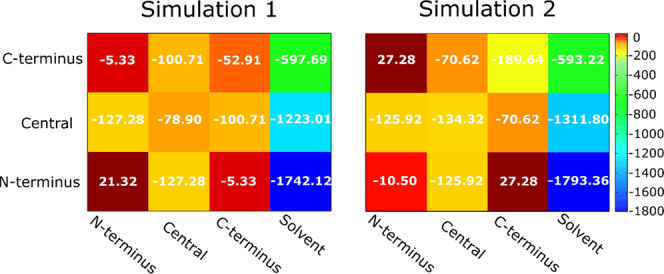
Figure 6.

Sum of electrostatic and van der Waals energy (kcal/mol) for regions of different chains and solvent at T = 300.38 K. The numbers within the squares are the average values, while the color coding indicates the scale. The values of electrostatic and van der Waals components and their standard deviations are reported in Tables S2 and S3.
