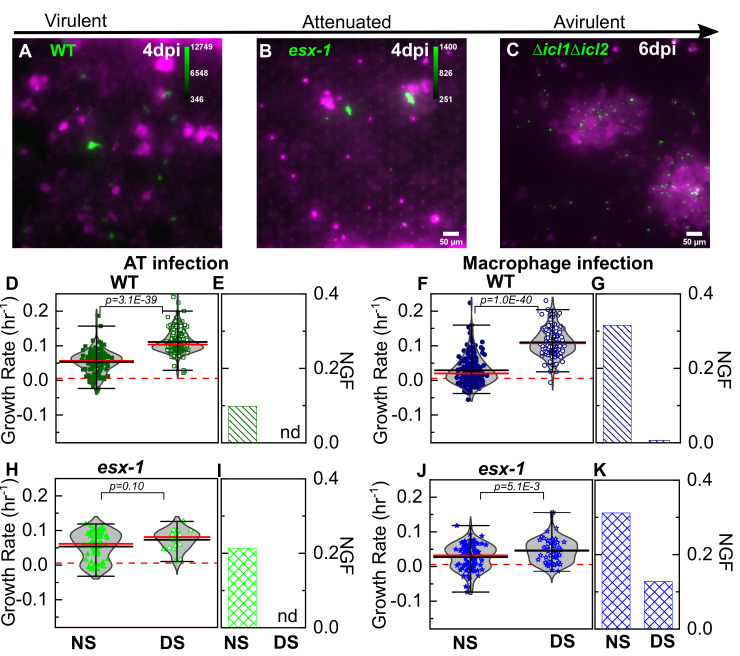
Figure 3. Attenuation of ESX-1-deficient strain is surfactant independent.
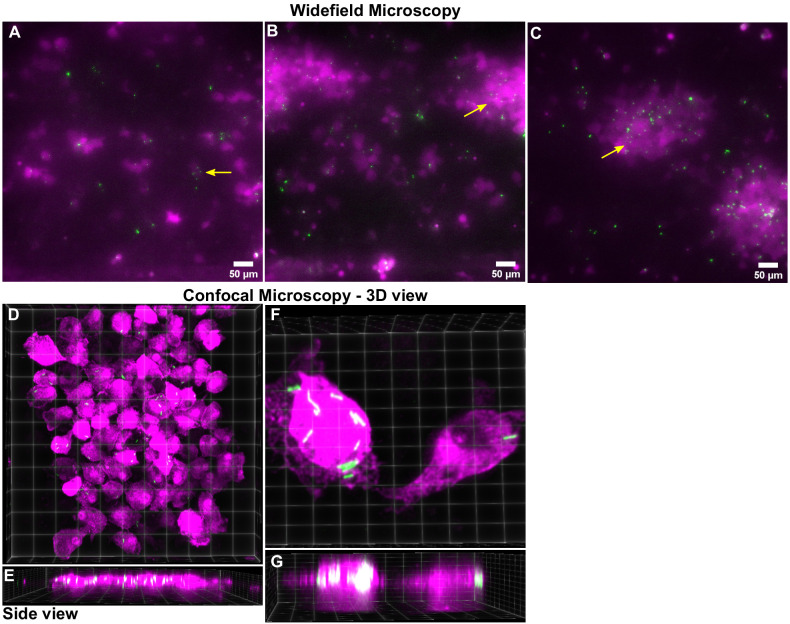
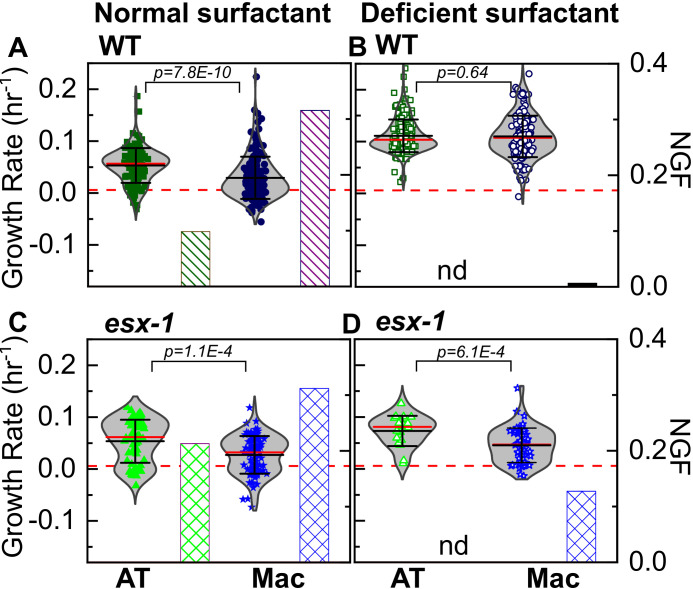
Snapshots from live-cell imaging in deficient surfactant (DS) conditions at 4 days post-infection for (A) wild-type Mtb, (B) an attenuated ESX-1-deficient strain (esx-1), and (C) at 6 days post-infection for the avirulent Δicl1Δicl2 strain infected at a higher inoculum. The calibration bar (inset in A-C) indicates the corresponding absolute intensities in the Mtb channel for a direct comparison across strains. Growth of the ESX-1-deficient strain is attenuated relative to wild-type Mtb (~10-fold decrease in intensity) and the Δicl1Δicl2 strain is unable to grow. Scatter plots indicate Mtb growth rate in individual ATs (D, H) and macrophages (F, J) and bar graphs indicate the non-growing fraction (NGF) of bacteria for infected ATs (E, I) and macrophages (G, K) in normal surfactant (NS) and DS conditions for wild-type and ESX-1-deficient strains. ‘nd’, not detected. Each dataset was fitted with a non-parametric kernel density estimation characterized by the mean (black) and median (red) values and whiskers represent the 1-99 percentile interval. For wild-type Mtb, DS conditions significantly increase growth rates and lower the NGF in both ATs (D, E) (n=122 for NS, n=219 for DS, p=3.1E-39) and macrophages (F, G) (n=185 for NS, n=122 for DS, p=1.0E-40). For the ESX-1-deficient strain, differences between NS and DS conditions are not significant in ATs (E) (n=61 for NS, n=25 for DS, p=0.10); for macrophage infection, differences are statistically significant (J) (n=93 for NS, n=55 for DS, p=5.1E-3), but a significant number of bacteria remain non-growing in DS conditions (K).


