Figure 4. LoC model under normal surfactant (NS) conditions accurately reflects in vivo dynamics.
Experimental data: Scatter plots of growth rates of intracellular bacteria from Figure 3 compared between infected macrophages (A, B) and ATs (C,D) under NS conditions (A, C) and deficient surfactant (DS) conditions (B, D) for wild-type and ESX-1-deficient strains (esx-1) of Mtb. The number of samples for each bacterial strain and LoC condition is given in Table 2. Mean and median values are indicated by black and red lines, respectively, and whiskers indicate the 1–99 percentile interval. p-Values were calculated using the Kruskal-Wallis one-way ANOVA test. Simulations: Simulations of independent low-dose aerosol infections with 50 WT or esx-1 bacteria. Simulated bacteria grow at rates randomly chosen from the kernel density estimations for the respective populations in Figure 3F and J, respectively. (E) In NS conditions, mean bacterial numbers for wild-type Mtb are significantly higher (p = 2.3E-6, n = 100) than for ESX-1-deficient Mtb. (F, G) Plots of the logarithm of ESX-1-deficient population size relative to WT (esx-1/WT) at the indicated timepoints for NS (F) and DS (G) conditions. Each datapoint represents the mean (esx-1/WT) ratio from five mice bootstrapped from the larger population (n=1000) for each strain. The attenuation of the ESX-1-deficient strain initially increases but then levels off with a spread of (esx-1/WT) ratios by 14 days post-infection. Mean (black) and median (red) values are indicated, and whiskers indicate the standard error of the mean.

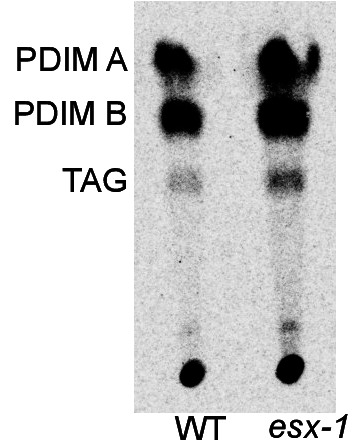
Figure 4—figure supplement 1. Characterization of the ESX-1 deficient strain for PDIM production.