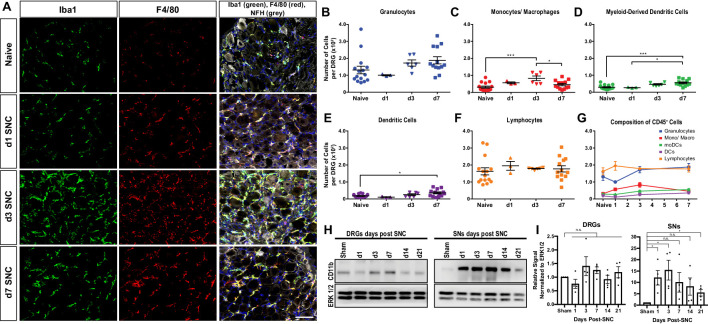
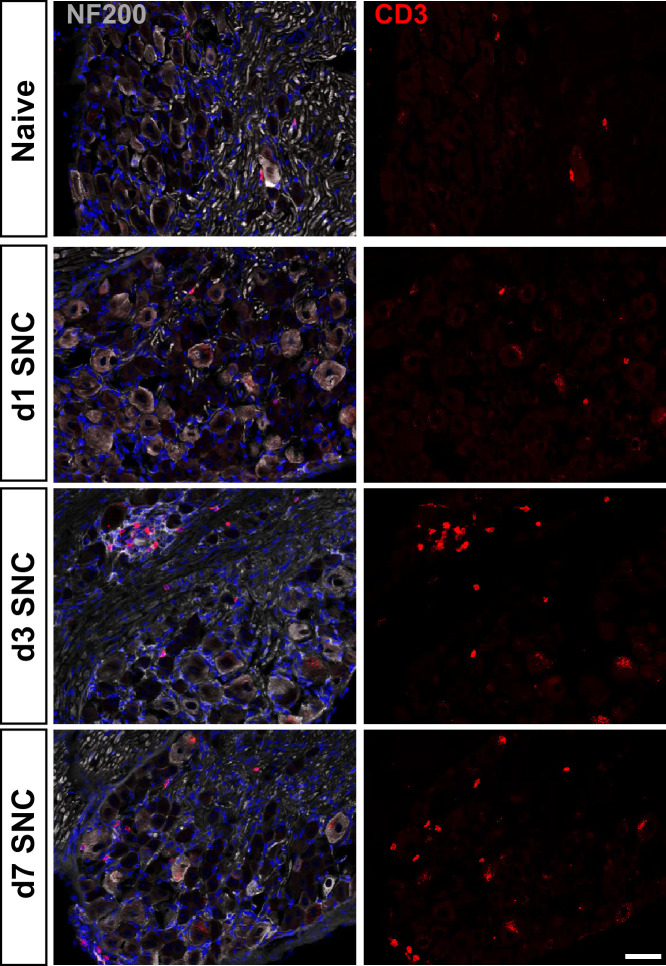
Figure 2. Immune cell profiles in axotomized DRGs.
(A) Representative images of L4 DRG cross sections from naïve mice, d1, d3, and d7 post-SNC. Macrophages were stained with anti-Iba1 and anti-F4/80. Neurons were stained with anti-NFH. Scale bar, 50 µm. (B) Quantification of granulocytes per DRG detected by flow cytometry. For flow cytometry of DRGs, naïve mice (n = 14 biological replicates), d1 (n = 3), d3 (n = 5), and d7 (n = 12) post-SNC mice were used. Granulocytes (CD45+, CD11b+, Ly6G+) per DRG are shown. (C) Quantification of Mo/Mac (CD45+, CD11b+, CD11c-, Ly6G-) per DRG. (D) Quantification of MoDC (CD45+, CD11b+, CD11c+, Ly6G-) per DRG. (E) Quantification of cDC (CD45+, CD11b-, CD11c+, Ly6G-) per DRG. (F) Quantification of lymphocytes (CD45+, CD11b-) per DRG. (G) Composition of CD45+ leukocytes in lumbar DRGs identified by flow cytometry. Flow data are represented as mean cell number ± SEM. Each data point represents L3-L5 DRGs pooled from three to four animals (18–24 DRGs), biological replicates, n = 3–14. Statistical analysis was performed in GraphPad Prism (v7) using one-way or two-way ANOVA with correction for multiple comparisons with Tukey’s post-hoc test. For B-F, unpaired two-tailed t-test with Welch’s correction. A p value < 0.05 (*) was considered significant. p<0.01 (**), p<0.001 (***), and p<0.0001 (****). (H) Western blots analysis of DRGs and sciatic nerves (SNs) prepared from sham operated mice and mice at different post-SNC time points (d1–d21), probed with anti-CD11b and anti-ERK1/2 as loading control. (I) Quantification of CD11b signal in DRGs and SNs. Unpaired two-tailed Student’s t-test compared to sham operated. n.s. not significant, *p<0.05, biological replicates n = 4 (with four mice for each time point).


