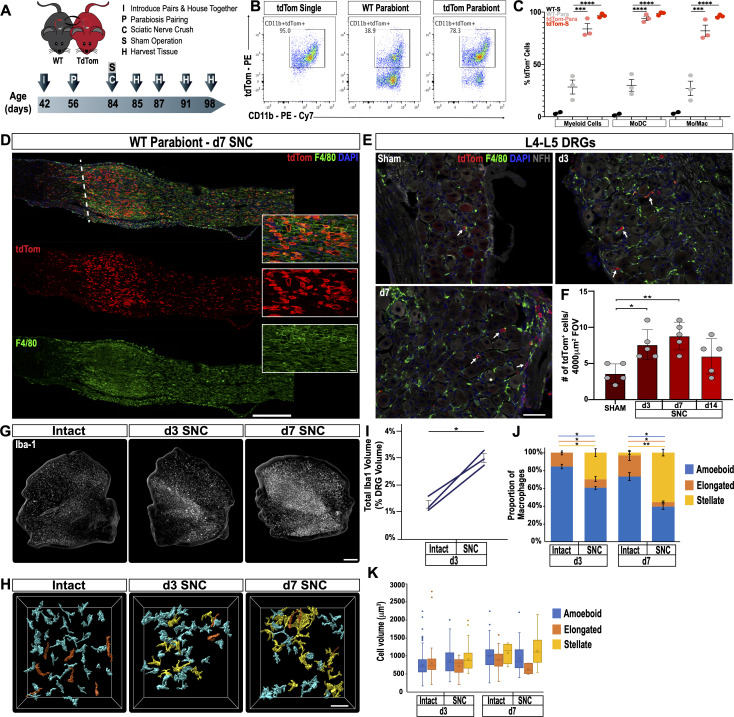
Figure 3. Sciatic nerve injury triggers massive accumulation of hematogenous leukocytes in the injured nerve but not axotomized DRGs.
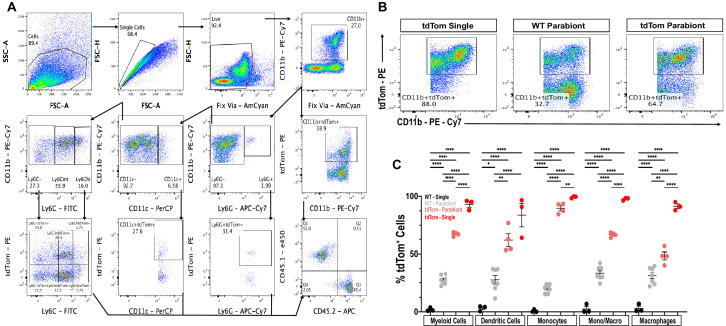
(A) Parbiosis complex of a wildtype (WT) and a tdTomato (tdTom) mouse. Mice were surgically paired at postnatal day 56. The timeline of the experiment is shown. (B) Flow cytometric analysis of sciatic nerve trunks collected from non-parabiotic (single) tdTom mice, WT parabionts, and tdTom parabionts. Dotplot of live (CD11b+, tdTom+) cells in the d3 post-SNC nerve. (C) Quantification of tdTom+ myeloid cells in the 3d injured nerve of WT single mice (WT-S), WT parabiont (WT-para), tdTom parabiont (tdTom-para), and tdTom single (tdTom-S) mice. The fraction of tdTom+ myeloid cells (CD45+, CD11b+), MoDC (CD45+, CD11b+, CD11c+, Ly6G-), and Mo/Mac (CD45+, CD11b+, CD11c-, Ly6G-) is shown. For quantification of tdTom+ immune cells, nerves from the WT parabiont and the tdTom parabiont were harvested separately (three mice per data point) with n = 2–3 biological replicates. Flow data are represented as fraction of tdTom+ cells ± SEM. Statistical analysis was performed in GraphPad Prism (v8) using one-way ANOVA with correction for multiple comparisons with Tukey’s post-hoc test. p value of < 0.001 (***) and p<0.0001 (****). (D) Longitudinal sciatic nerves sections of the WT parabiont at d7 post-SNC. The nerve crush site is marked with a white dotted line, proximal is to the left, distal to the right. Anti-F4/80 (green) and tdTom+ cells (red) staining is shown. Scale bar, 500 µm, for insets, 20 µm. (E) Lumbar DRG cross sections of WT parabionts harvested from sham operated mice, at d3, and d7 post-SNC. Sections were stained with anti-F4/80 (green) and anti-NF200 (white). Hematogenous (tdTom+) leukocytes are marked with white arrows. Scale bar, 50 µm. (F) Quantification of tdTom+ cells per field of view (FOV = 4000 µm2) in DRG sections of the WT parabiont. Data are shown as number of tdTom+ cells ± SEM, n = 3–5 mice per time point. Student’s t test with p<0.5 (*) considered statistically significant, p<0.01 (**). (G) Whole mount anti-Iba1 immunofluorescence staining of L4 DRGs from intact, d3, and d7 post-SNC time points. Scale bar, 200 µm. (H) Morphological reconstruction of Iba1+ cells in DRGs with Imaris. Analysis of DRG resident macrophages revealed amoeboid (cyan) and elongated (orange) morphologies if the nerve was not injured. At d3 and d7 post-SNC, a subpopulation of Iba1+ cells with stellate (yellow) morphology was observed in DRGs. Scale bar, 50 µm. (I) Quantification of total volume of Iba1+ structures in DRGs, rendered by Imaris. The total volume of Iba1+ structures per DRG was quantified on the intact side and the injured side of the same mouse at d3 post-SNC (n = 3 mice). Paired Students t test, p value < 0.05 (*), was considered significant. (J) Quantification of Iba1+ cells with amoeboid, elongated, and stellate morphologies. (K) Quantification of cell volume of individual Iba1+ cells with amoeboid, elongated, and stellate morphologies. At d3 post-SNC, a total of 416 cells were reconstructed on the intact side and a total of 234 cells on the injured side. At d7 post-SNC, a total of 136 cells were reconstructed on the intact side and a total of 93 cells on the injured side. The distribution of morphological categories ± SEM (J) and cell volumes ± SEM (K) are shown. Paired, two-tailed Student’s t test, a p value < 0.05 (*) was considered significant. p<0.01 (**).


