. 2020 Dec 2;9:e60223. doi: 10.7554/eLife.60223

Figure 5. The cellular landscape of injured peripheral nerve.

(A) Singe-cell transcriptome of injured mouse sciatic nerve at d3 post-SNC, n = 3 biological replicates. Unsupervised Seurat-based clustering identifies 24 cell clusters. Cell type identity for each cluster was determined by expression analysis of established markers. (B) List of all cell types identified by scRNA-sequencing. The size (percentile) of cell clusters and lineage relationships are shown. Abbreviations for cell cluster identities are indicated and used throughout the manuscript. (C–J) Feature plots of established cell markers used for identification of major cell types in the injured nerve. Shown are UMAP plots with markers for myeloid cells (Itgam/CD11b), fibroblast-like/mesenchymal cells (Pdgfra, Sox9), repair Schwann cells (Ncam1, Ngfr/p75), endothelial cells (Pecam/CD31), pericytes/smooth muscle vascular cells (Pdgfrb), and mitotically active cells (Mki67/Ki67). Expression levels are color coded and calibrated to average gene expression. (K) Dotplot shows cell-type-specific expression of the most abundant transcription regulators (TRs) in Fb, dMES, eMES, pMES, CL, SC1-3, EC1-3, PC1, and PC2 clusters identified by scRNA-seq of 3d injured sciatic nerve. Dotplot analysis shows the average gene expression (color coded) and percent of cells (dot size) that express the listed TRs in each cluster.

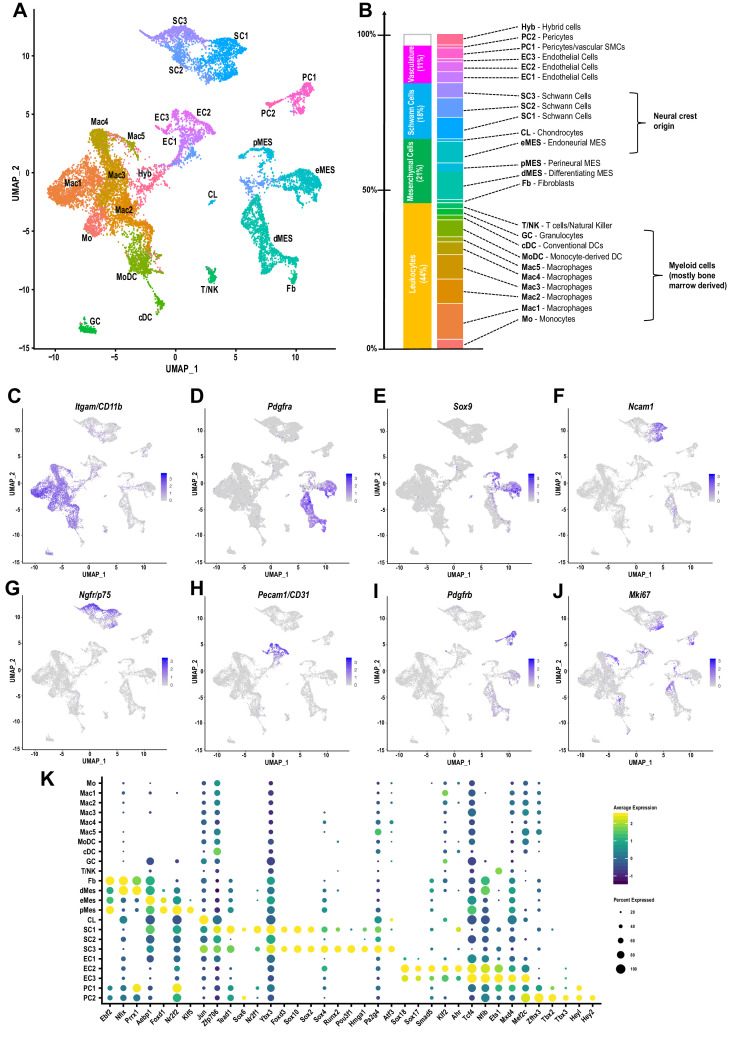
Figure 5—source data 1. List of top 100 cluster enriched genes for all cell clusters identified in the 3d post-SNC nerve.
First column (P_val), probability of getting the ‘elevated’ expression values in these cells under the null hypothesis that all cells have the same expression of the gene. Second column (avg_logFC), average log2 Fold-Change between cells in this cluster relative to cells in all other clusters. Third column (pct.1), percent of the cluster's cells which express the gene. Fourth column (pct.2), percent of non-cluster cells which express the gene. Fifths column (p_val_adj), p_val adjusted so that 5% of the list is expected to have false positives. Links to STRING REACTOME pathway analysis for each cell cluster are included on the last page.
elife-60223-fig5-data1.xlsx (172.4KB, xlsx)

Figure 5.

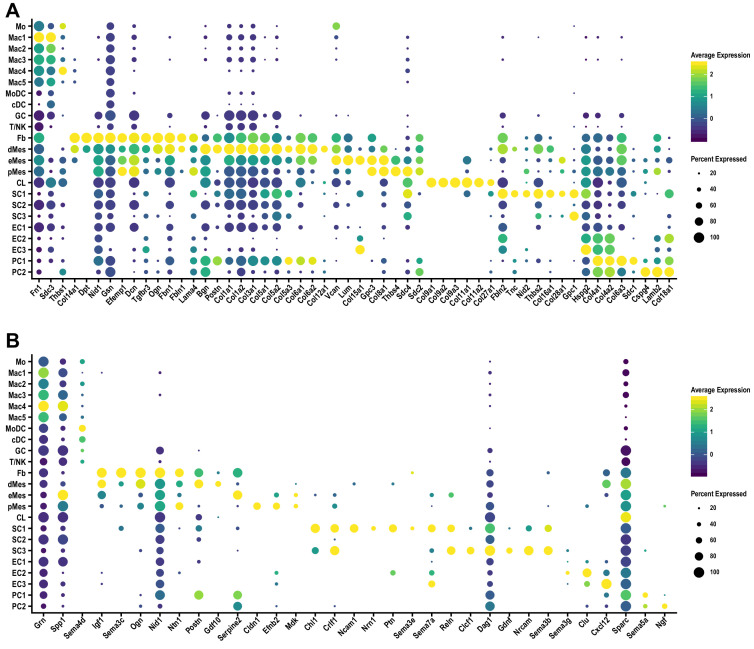
Figure 5—figure supplement 1. Cell-cluster-specific expression of ECM components and molecules that regulate axon growth in the injured sciatic nerve.

Figure 5—figure supplement 1.

(A) Dotplot analysis of extracellular matrix molecules prominently expressed in the d3 post-SNC nerve. (B) Dotplot analysis of gene products implicated in axon growth, guidance, and regeneration in the d3 post-SNC nerve. Expression levels, normalized to average gene expression (color coded) are shown. For each cell, cluster the percentile of cells expressing a specific gene is indicated by the dot size.
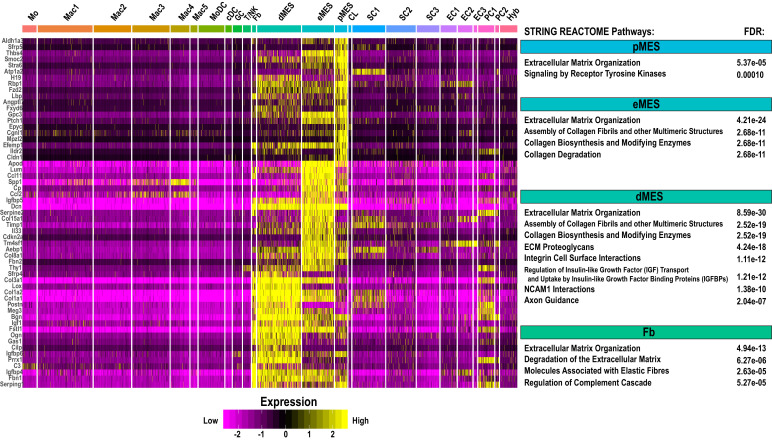
Figure 5—figure supplement 2. Single-cell gene expression in mesenchymal cell clusters in injured sciatic nerve.

Figure 5—figure supplement 2.

Heatmap of top genes enriched in perineural mesenchymal cells (pMES), endoneurial mesenchymal cells (eMES), differentiating mesenchymal cells (dMES), and epineural fibroblasts (Fb) in the d3 post-SNC nerve. Expression levels are calibrated to median gene expression. STRING REACTOME Pathways are listed. FDRs (false discovery rates) are shown.
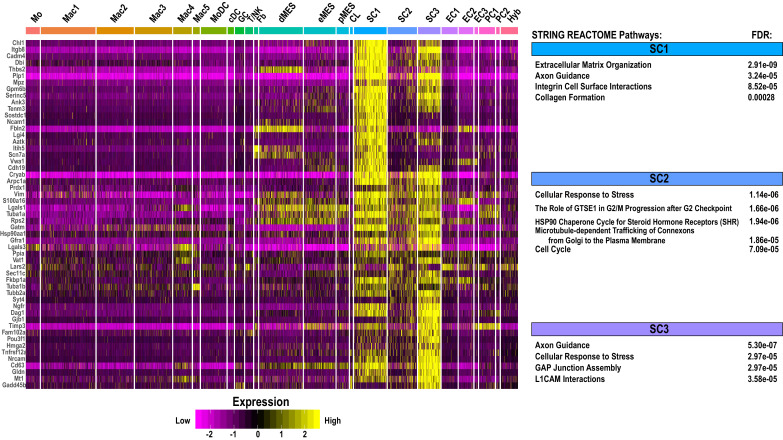
Figure 5—figure supplement 3. Single-cell gene expression in Schwann cell clusters in injured sciatic nerve.

Figure 5—figure supplement 3.

Heatmap of top genes enriched in repair Schwann cell clusters (SC1, SC2, and SC3) in the d3 post-SNC nerve. Expression levels are calibrated to median gene expression. STRING REACTOME pathways are listed. FDRs (false discovery rates) are shown.
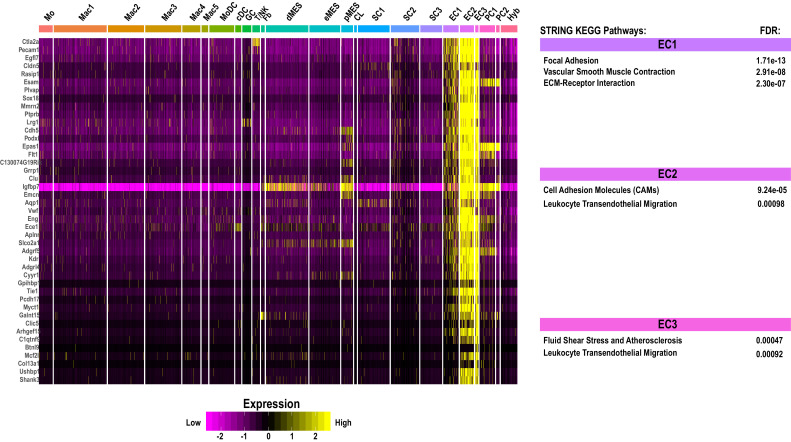
Figure 5—figure supplement 4. Single-cell gene expression in endothelial cell clusters in injured sciatic nerve.

Figure 5—figure supplement 4.

Heatmap of top genes enriched in endothelial cell clusters (EC1, EC2, and EC3) in the d3 post-SNC nerve. Expression levels are calibrated to median gene expression. STRING KEGG Pathway analysis and FDRs (false discovery rates) are shown.
Figure 5—figure supplement 5. Single-cell gene expression in pericyte cell clusters in injured sciatic nerve.

Figure 5—figure supplement 5.

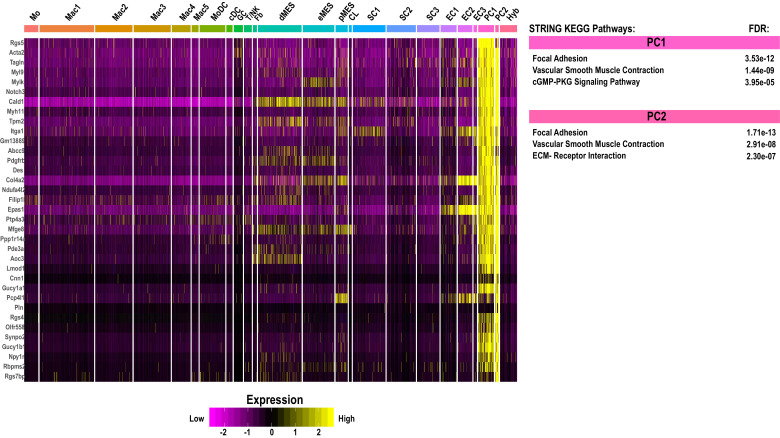
Heatmap of top genes enriched in pericyte clusters (PC1 and PC2) in the d3 post-SNC nerve. Expression levels are calibrated to median gene expression. STRING REACTOME Pathways are listed. FDRs (false discovery rates) are shown.
Figure 5—figure supplement 6. Single-cell gene expression of immune modulatory molecules in the injured PNS tissue.

Figure 5—figure supplement 6.

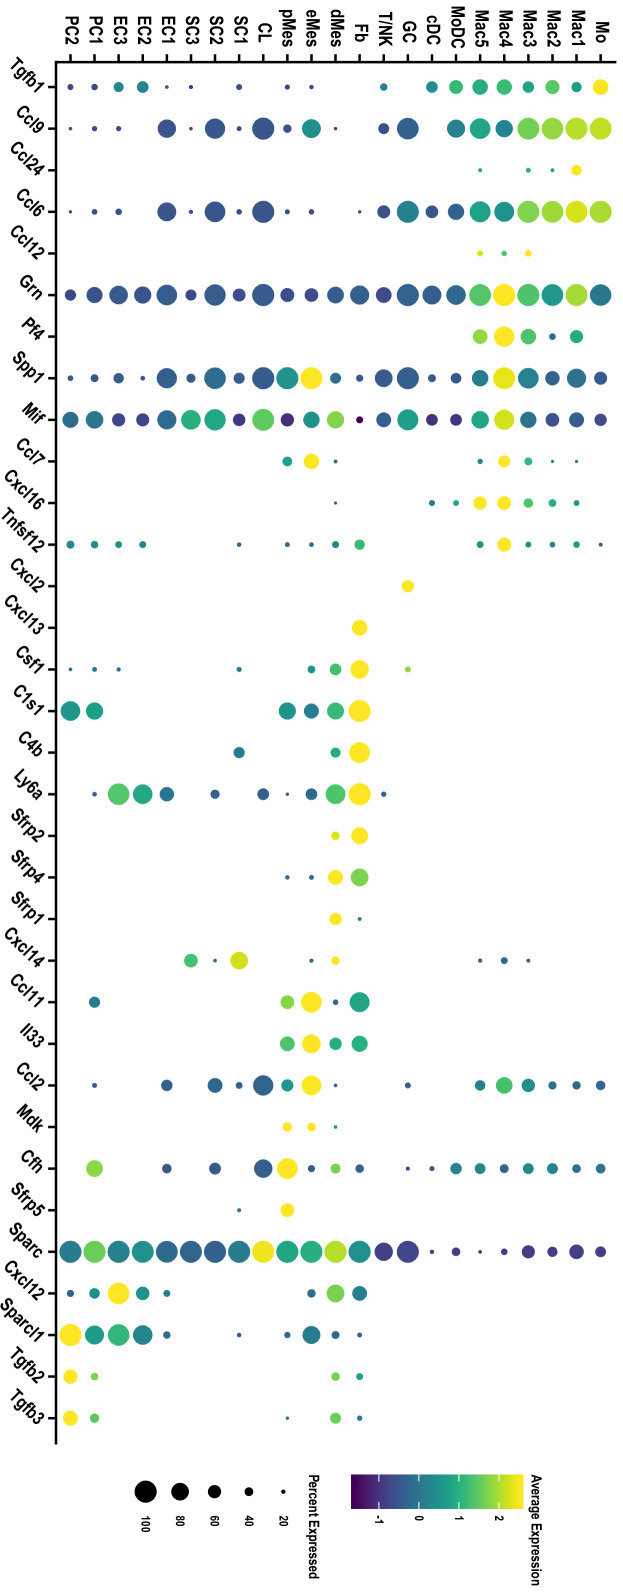
Dotplot analysis of gene products with immune modulatory function in the d3 post-SNC nerve. Expression levels, normalized to average gene expression (color coded). For each cell cluster, the percentile of cells that express the listed gene (dot size) is shown.