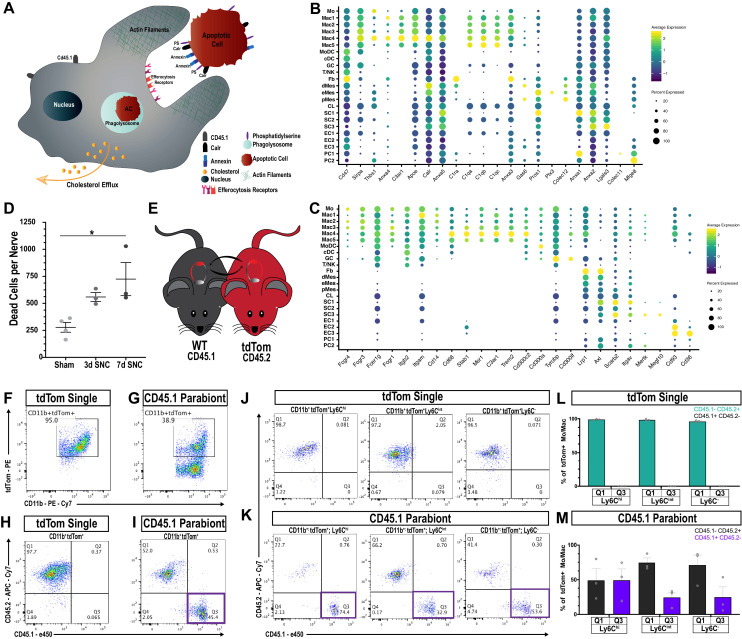
Figure 7. Macrophages ‘eat’ dying leukocytes in the injured nerve.
(A) Cartoon of phagocyte with actin rich phagocytic cup eating a tdTom+apoptotic cell (AC). ‘Eat me’ signals displayed on the surface of AC allow direct or indirect recognition via engulfment receptors. Following engulfment by phagocytes, AC are digested in the phagolysosome. Cellular cholesterol levels are controlled by upregulation of specific efflux mechanisms. (B) scRNAseq dotplot analysis of ‘don’t eat me’ molecules (Cd47, Sirpa) and bridging molecules prominently expressed across cell types in the d3 post-SNC nerve. Average gene expression and percentage of cells expressing the gene are shown. (C) scRNAseq dotplot analysis of engulfment receptors in the d3 post-SNC nerve. Average gene expression and percentage of cells expressing the gene are shown. (D) Flow cytometric analysis of dead cells accumulating in the d3 and d7 nerve (n = 3 biological replicas per time point). Data are represented as mean ± SEM. (E) Parabiosis complex of WT (CD45.1) mouse with a (CD45.2) tdTom reporter mouse. (F) Flow cytometry dot plot showing tdTom+ myeloid cells (CD45.2+, CD11b+) in the sciatic nerve of non-parabiotic (tdTom single) mice. (G) Flow cytometry dot plot showing tdTom+ myeloid cells (CD11b+) in the sciatic nerve of the WT CD45.1 parabiont. (H) Flow cytometry dot plot of CD11b+, tdTom+-gated cells from non-parabiotic (tdTom+ single) mice, analyzed for CD45.1 and CD45.2 surface staining. (I). Flow cytometry dot plot of CD11b+, tdTom+-gated cells from the CD45.1 parabiont, analyzed for CD45.1 and CD45.2 surface staining. Quadrant 3 (Q3) identifies CD45.1+, tdTom+, CD45.2- myeloid cells, indicative of ongoing efferocytosis. (J) Flow cytometry dot plots of Mo/Mac in the injured nerve of non-parabiotic (tdTom single) mice. Mo/Mac maturation was assessed by Ly6C surface staining. Shown are monocytes (Ly6Chi), Mo/Mac (Ly6Cint), and Mac (Ly6C-). (K) Flow cytometry dot plots of Mo/Mac in the injured nerve of the CD45.1 parabiont. Shown are monocytes (Ly6Chi), Mo/Mac (Ly6Cint), and Mac (Ly6C-). The quadrant with CD45.1+, tdTom+, CD45.2- cells (Q3) is highlighted. Biological replicates n = 3, with three parabiotic pairs per replica. (L, M) Quantification of CD45.1+, tdTom+, CD45.2- cells in quadrant Q3 and CD45.2+, tdTom+, CD45.1- cells in Q1. (L) In the injured nerve of (tdTom single) mice, no CD45.1+ cells are detected. (M) In the injured nerve of the WT CD45.1 parabiont, CD45.1+, tdTom+, CD45.2- Mo (Ly6Chi), Mo/Mac (Ly6Cint), and Mac (Ly6C-) are found; n = 3 biological replicates, with three parabiosis pairs pooled per replicate.


