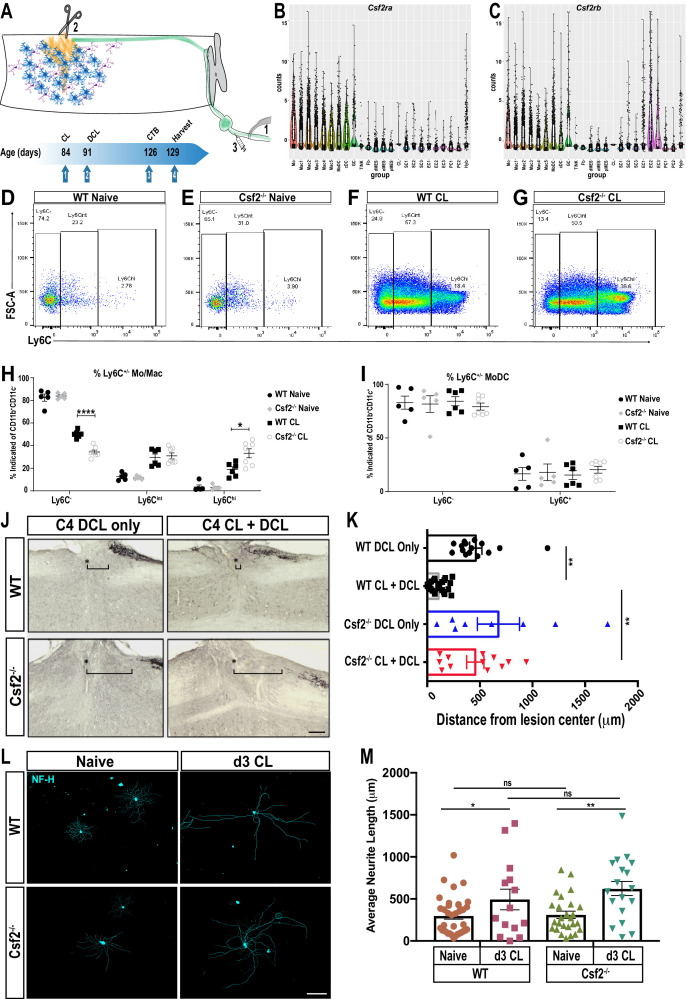
Figure 8. GM-CSF is required for conditioning lesion induced dorsal column axon regeneration.
(A) Schematic showing conditioning lesion to the sciatic nerve (1) followed by dorsal column lesion (2) and tracer injection in the nerve (3). Experimental time line of conditioning lesion (CL), dorsal column lesion (DCL), cholera-toxin B (CTB) injection, and time of tissue harvest are shown. (B, C) Violin plots of Csf2ra and Csf2rb expression in the d3 post-SNC sciatic nerve, as assessed by whole nerve tissue scRNAseq analysis. (D–G) Flow cytometry dot plots of WT and Csf2-/- nerves from naive mice and 3d following conditioning lesion (CL) to the sciatic nerve. Ly6C surface staining was used to assess maturation of the Mo/Mac population. Ly6Chi (immature), Ly6Cint, and Ly6C- (mature) cells are shown. (H) Quantification of percentage of Mo/Mac (CD45+ CD11b+ CD11c- Ly6G-) that are Ly6C-, Ly6Cint and Ly6Chi in WT and Csf2-/- mice without (naive) and with CL. (I) Quantification of surface Ly6C on MoDC (CD45+ CD11b+ CD11c+) in WT and Csf2-/- mice without (naïve) and with CL. Unpaired t-test with correction for multiple comparisons using Holm-Sidak method, *p<0.05; ****p<0.0001. (J) Sagittal sections through cervical spinal cords of wild-type (WT) and Csf2-/- mice, 5 weeks following bilateral DCL at cervical level 4 (C4). The spinal cord lesion site is labeled with a star (*), rostral is to the left and caudal is to the right. To enhance dorsal column axon regeneration, a CL to the sciatic nerve was performed 7 days prior to DCL (CL + DCL). Dorsal column axons were visualized by CTB injection in the sciatic nerve. The brackets indicated the distance between the lesion center and the rostral tip of CTB labeled axons. (K) Quantification of axon regeneration. The distance between CTB labeled axon tips and the center of the spinal lesion was measured; 0 µm marks the injury site, the gap between the lesion center and traced axons (=retraction) is shown for WT and Csf2-/- without CL. For each genotype and experimental condition n ≥ 8 biological replicates. One-way ANOVA with Tukey posthoc correction. **p<0.01. Scale bar, 200 µm. (L) Representative images primary DRG neurons isolated from WT and Csf2-/- mice, with and without a d3 CL. Cultures were stained with of anti-neurofilament H (NF-H) (M) Quantification of neurite length. Neuromath was used to quantify neurite length, neurites less than 30 µm in length were excluded from the analysis. n ≥ 114 neurons, n = 2 biological replicates. Two-tailed Student’s t-Test with Tukey posthoc correction was used. *p<0.05; **p<0.01. Scale bar, 500 µm.


