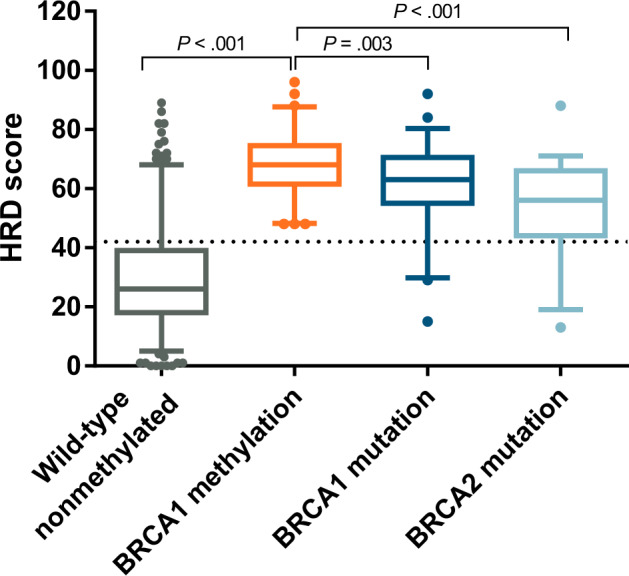
Figure 2.

HRD score as assessed on 447 tumor samples obtained from TCGA 2011 and MDACC 2010 cohorts, according to underlying BRCA1/2 aberration. Box plots depict the median and 95% confidence intervals of the HRD scores according to the underlying BRCA1/2 aberration in TCGA 2011 and MDACC 2010 cohorts. The dotted line represents the threshold value of 42 above which samples are considered to be homologous recombination deficient as per the HRD score assay. P values denote the level of statistical significance between sets of groups (unpaired t tests). Numbers in each subgroup are as follows: wild-type, n = 286; BRCA1 methylation, n = 65; BRCA1 mutation, n = 57; BRCA2 mutation, n = 39. HRD = homologous recombination deficiency; MDACC = MD Anderson Cancer Center; TCGA = The Cancer Genome Atlas
