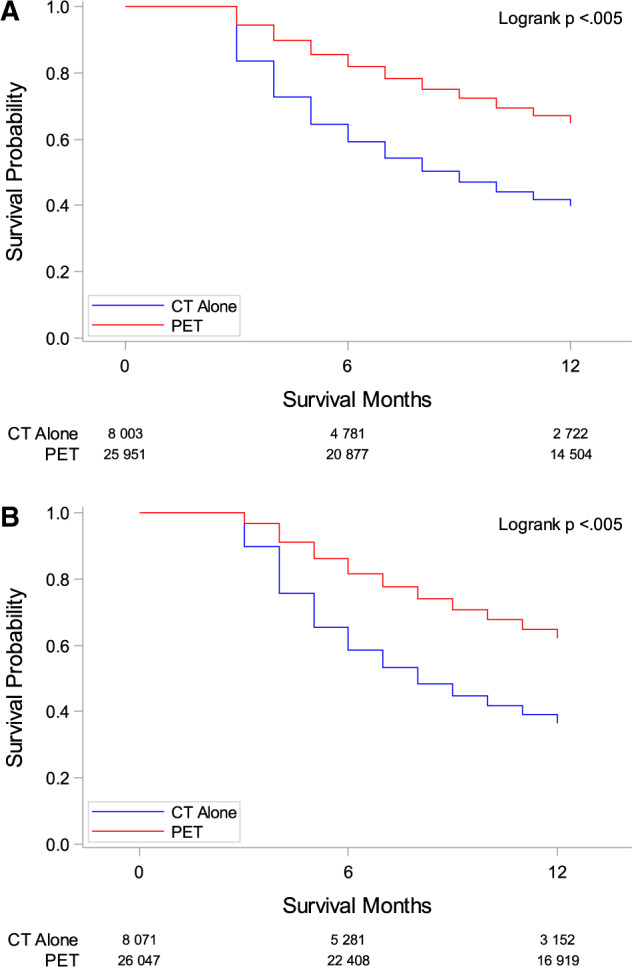
Figure 4.

Survival curves comparing computerized tomography imaging (CT) and positron emission tomography imaging (PET) with or without CT. A) Cancer-specific Kaplan-Meier survival curves comparing CT alone vs PET. P value was generated using the two-sided log-rank test method. B) Overall Kaplan-Meier survival curves comparing CT alone vs PET. P value was generated using the two-sided log-rank test method.
