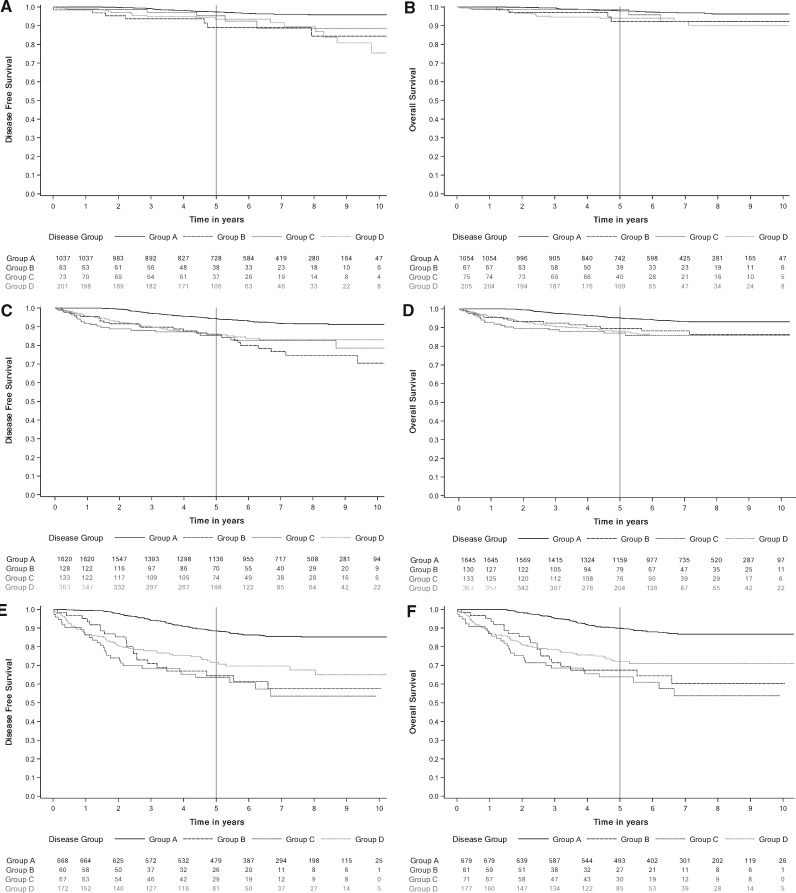
Figure 3.
Kaplan-Meier curves for disease-free survival (DFS) and overall survival (OS) stratified by stage. A) Stage I DFS. B) Stage I OS. C) Stage II DFS. D) Stage II OS. E) Stage III DFS. F) Stage III OS. Group A received a full course of trastuzumab (17-18 cycles) without any cardiac events (CEs) between day 1, cycle 1, and 90 days after the final cycle. Group B had a CE within the study period. Group C had 16 or fewer cycles of trastuzumab, had no CEs, and stopped treatment within 30 days of the last cardiac imaging test. Group D had 16 or fewer cycles of trastuzumab, had no CEs, and stopped treatment more than 30 days after the last cardiac imaging test.

