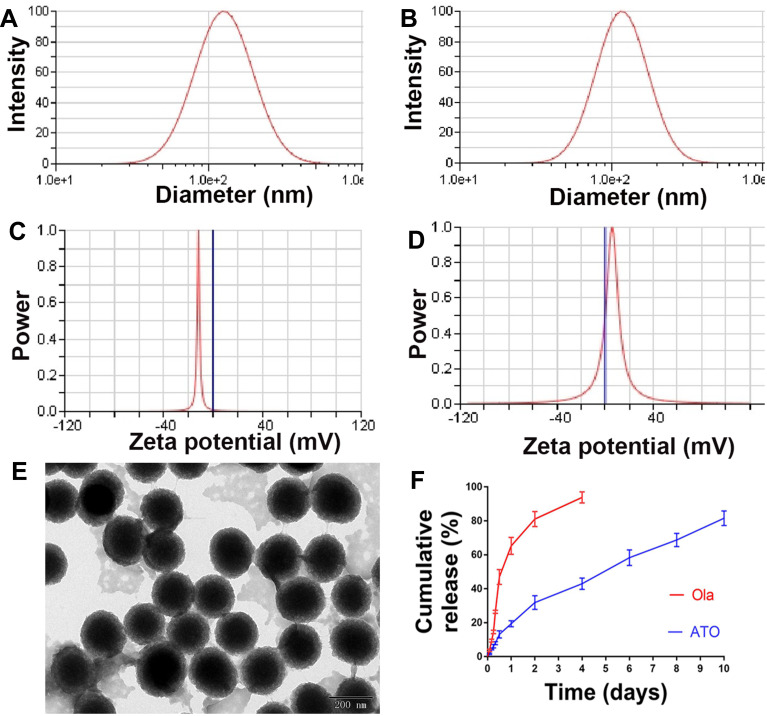
Figure 3.
The characterization of ATO. (A) Particle size distribution of ATO, presented a mean size of 240.62 ± 8.79 nm. (B) Particles size distribution of NATO, presented a mean size of 205.43 ± 3.13 nm. (C) Zeta potential of ATO, showed a negative surface charge of −10.5 ± 1.09 mV. (D) Zeta potential of NATO, showed a positive surface charge of 4.67 ± 1.17 mV. (E) Transmission electron microscopy image of ATO (the scale is 50 nm). (F) Drug release study of Ola and ATO.

