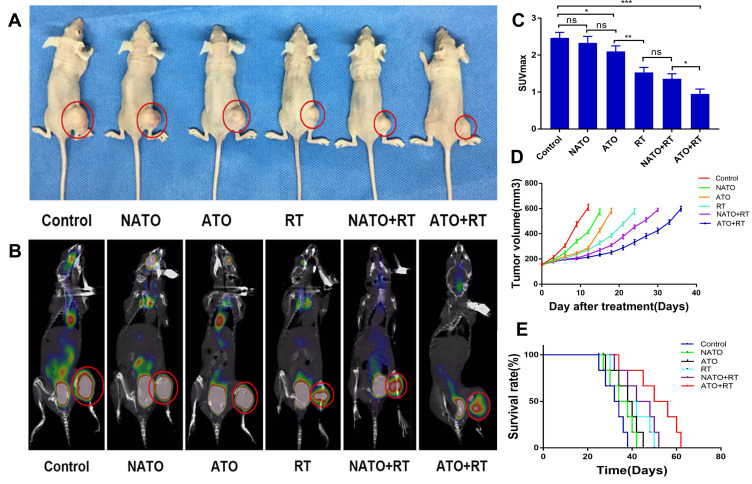
Figure 5.
Evaluation of antitumor efficiency in vivo. (A) General view of tumor-bearing example mice with different treatments. (B) PET/CT images of example mice in each group. (C) Quantitative analysis of SUVmax of mice in each group. *P<0.05; **P<0.01; ***P<0.001; ns: no statistical significance. (D) Tumor growth curves of mice in each group. (E) The survival curves of mice in each group.

