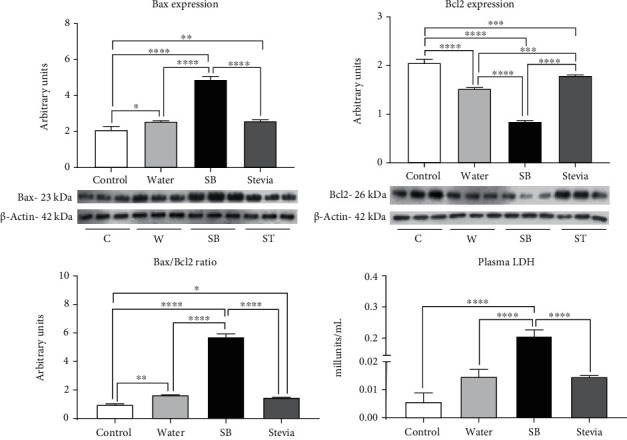
Figure 5.

Apoptosis markers. Renal cortex Bax and Bcl2 expressions and Bax/Bcl2 ratio. Plasma LDH concentrations. For western blotting, 3 randomly selected samples per group were analyzed. The results are presented as mean ± SD and analyzed by one-way ANOVA followed by Tukey's multiple comparison test. Statistical significance was established as ∗p ≤ 0.05, ∗∗p ≤ 0.01, ∗∗∗p ≤ 0.001, and ∗∗∗∗p ≤ 0.0001.
