Figure 1.

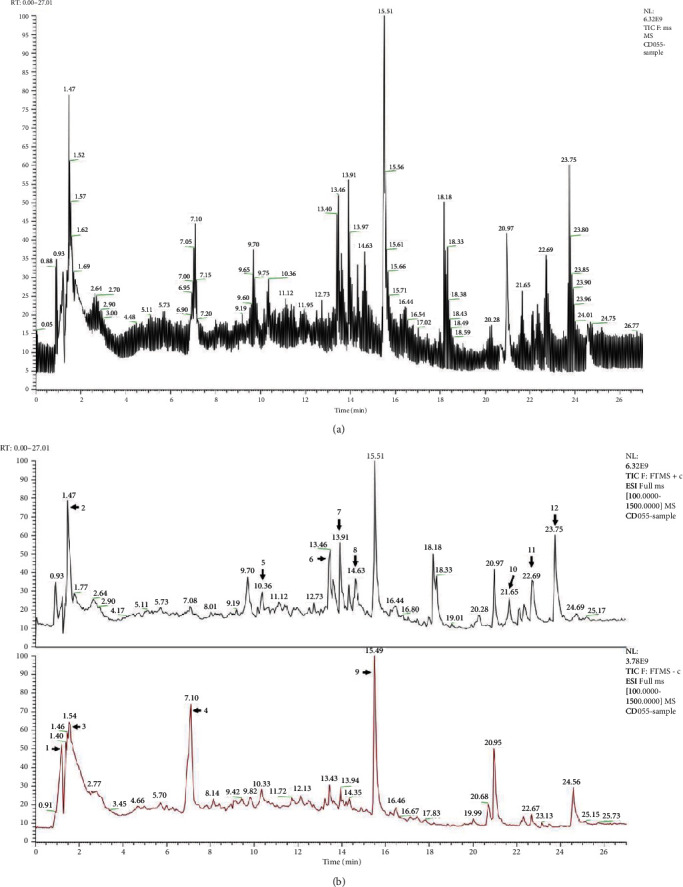
The LC-ESI-MS chromatograms of EFH. (a) The total ion currents of EFH. (b) Positive mode in black and negative mode in red. Peak assignments are listed in Table 2.

The LC-ESI-MS chromatograms of EFH. (a) The total ion currents of EFH. (b) Positive mode in black and negative mode in red. Peak assignments are listed in Table 2.