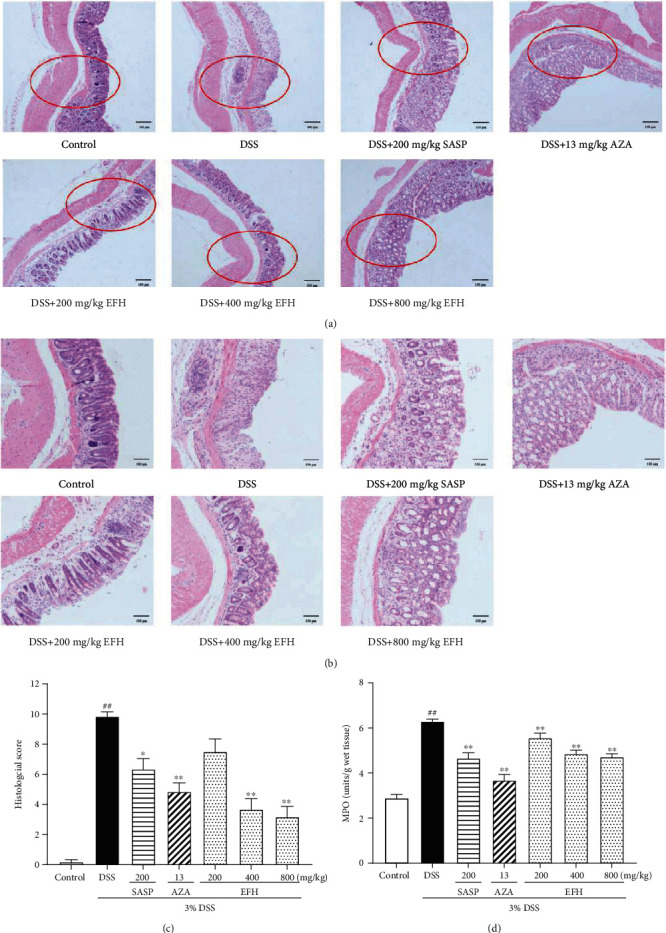
Figure 3.

EFH suppressed inflammatory infiltration in DSS-induced colitis. H&E staining of the formalin-fixed sections of colon (scale bars, 100 μm). (a) Magnification ×200 (the parts in red circles were enlarged), (b) magnification ×400, (c) histological scores, and (d) MPO activity of colon tissue in DSS-induced colitis mice. Data are presented as the means ± S.E.M. (n = 10). ##p < 0.01 vs. the control group; ∗p < 0.05, ∗∗p < 0.01 vs. the DSS group.
