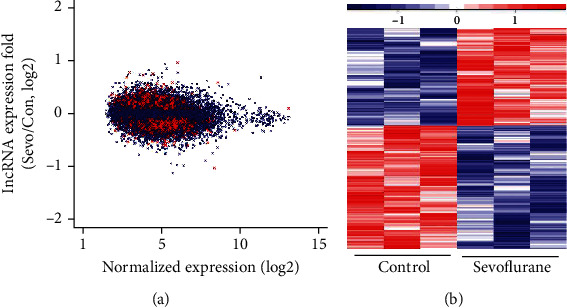
Figure 2.

Differentially expressed lncRNAs after sevoflurane anesthesia in microarray analysis. (a) Ratio of gene expression in sevoflurane group to control condition (y-axis) and average expression of genes in sevoflurane group versus that in control condition (x-axis), presented as a Bland-Altman plot of our microarray analysis. Highlighted in red are lncRNAs with significant changes in expression (p < 0.05). (b) The heat map shows lncRNAs with significant changes from microarray analysis (p < 0.05).
