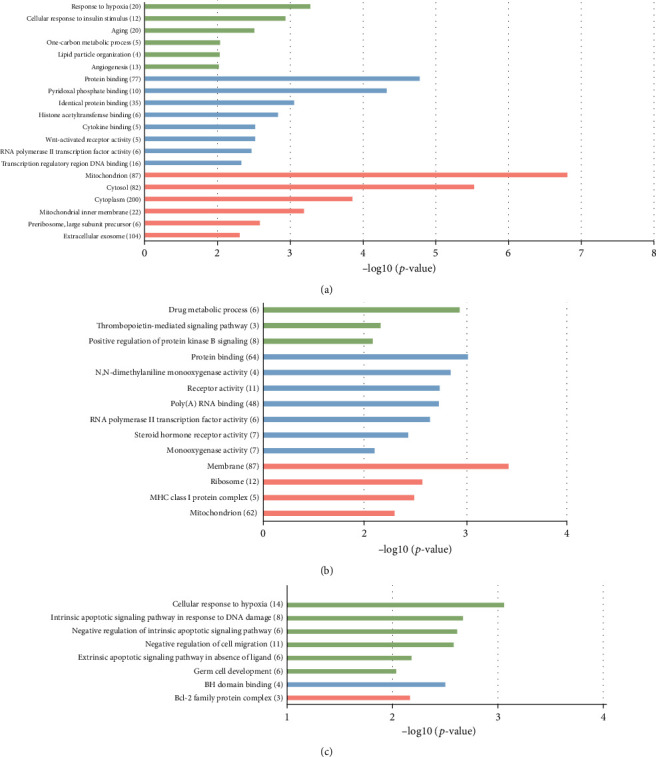
Figure 5.

GO analysis of potential target genes of differentially expressed lncRNA NONMMUG000308 (a), NONMMUG001518 (b), and NONMMUG001518 (c). y-axis: GO terms of biological process, cellular component, and molecular function. The green columns indicate the biological process, the blue columns indicate molecular function, and the red columns indicate cellular component. The numbers of differentiated genes enriched in each term were displayed in brackets. x-axis: the negative logarithm of p value.
