
Figure 7.
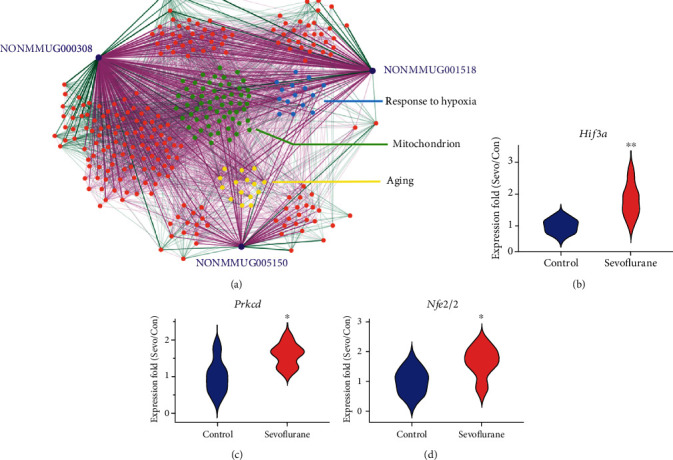
(a) LncRNA-mRNA coexpression network in the aged hippocampus after sevoflurane anesthesia. The purple nodes represent lncRNAs. The blue, green, yellow, and orange nodes represent gene-annotated GO terms response to hypoxia, mitochondrion, aging, and others. Coexpression pairs of lncRNA-mRNA whose Pearson correlation coefficient (PCC) > 0.85 and mRNA-mRNA pairs whose PCC > 0.95 were connected by straight lines. Positive correlations are shown in red lines, and negative correlations in green lines. Lower transparency of edges means higher PCC. qPCR validation for representative differentially expressed genes (b) Hif3a from term hypoxia, (c) Prkcd from term mitochondrion, and (d) Nfe2l2 from term aging. n = 6, ∗p < 0.05, and ∗∗p < 0.01 indicated differentiated samples compared with the control condition.