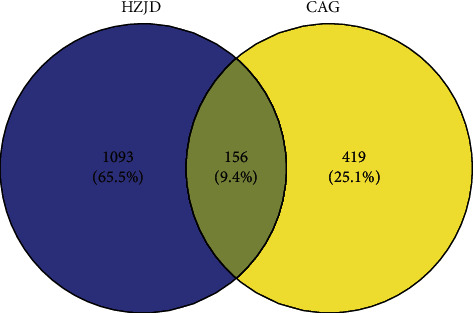
Figure 2.

Venn diagram of HZJD decoction and CAG-related targets. The blue part represents the targets of HZJD decoction, the yellow part represents the genes associated with CAG, and the intersection represents the potential targets for the ingredients of HZJD decoction in the treatment of CAG.
