Figure 1.
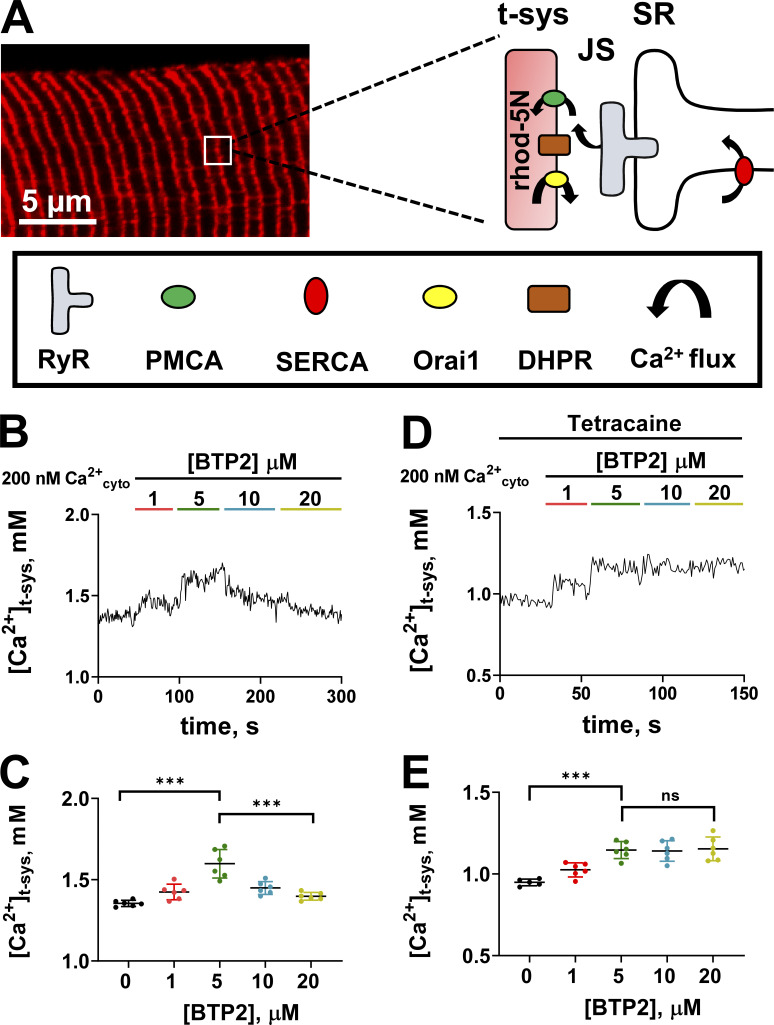
Effect of BTP2 on resting [Ca2+]t-sys. (A) t-system–trapped rhod-5N in a mechanically skinned fiber and a schematic representation of the key players of calcium handling in the junctional membranes. (B) Representative t-system calcium transient from a fiber exposed to increasing concentrations of BTP2. (C) Mean ± SD of [Ca2+]t-sys of fibers exposed to increasing concentrations of BTP2 (n = 6). One-way ANOVA followed by post hoc Tukey’s test revealed significant differences between 0 versus 5 µM BTP2 (P < 0.0001) and 5 versus 20 μM BTP2 (P < 0.0001). (D) Representative t-system calcium transient from a fiber exposed to increasing concentrations of BTP2 in the constant presence of RYR inhibitor 1 mM tetracaine. (E) Mean ± SD of [Ca2+]t-sys of fibers exposed to increasing concentrations of BTP2 in the presence of RYR inhibitor tetracaine (1 mM; n = 6). In the presence of tetracaine, one-way ANOVA followed by post hoc Tukey’s test revealed significant differences between 0 versus 5 µM BTP2 (***, P < 0.0001). Data are shown as mean ± SEM, with individual data points also shown. No differences between 5 versus 20 µM BTP2 were found (P > 0.999).

