Figure 6.
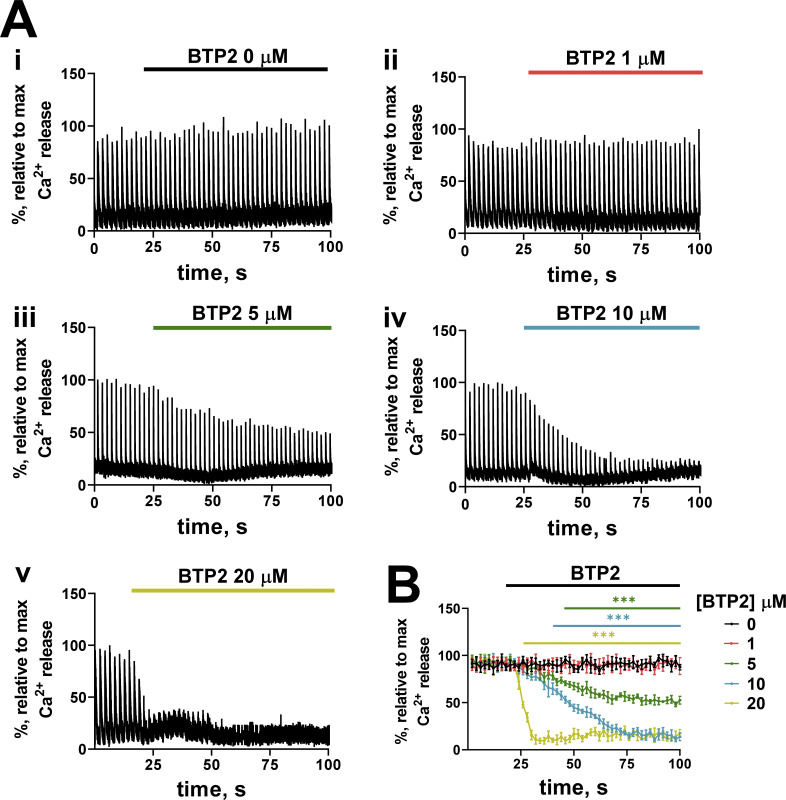
Effect of BTP2 on electrically evoked SR Ca2+ release. (A) Original recordings of mechanically skinned fibers exposed to increasing concentrations of BTP2 (i–v) obtained with confocal line scanning parallel to the fiber long axis. Ca2+ transients were normalized to the maximum peak value of rhod-2 fluorescence during electrical stimulation. (B) Mean of transient amplitude over time (n = 4–7). Data are presented as mean ± SD. Horizontal lines (color matched to [BTP2]) indicate where multiple t tests performed using the Holm-Sidak method revealed a significant decrease compared with 0 µM BTP2 treatment (***, P < 0.005).

