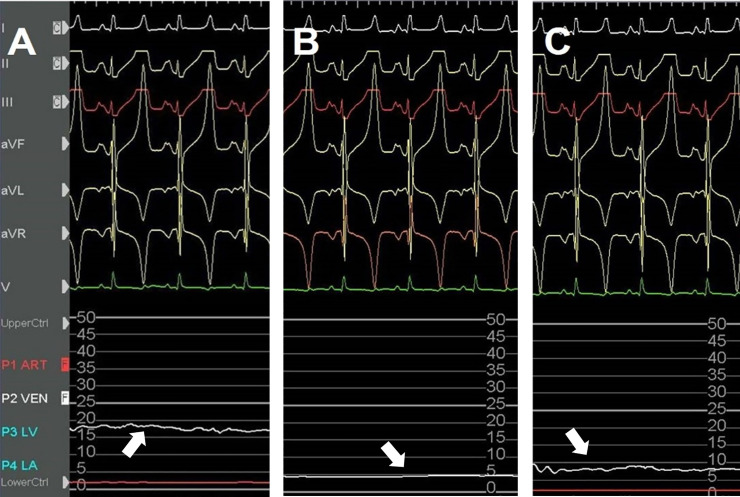
Fig 5. Representative image of the venous blood pressure response in the ischemic limb.
White arrows show a recording of the mean venous pressure, at baseline (T0), just after the arterial occlusion (T1), and 25 minutes after partial vein occlusion (T7). A decline after arterial occlusion (B) and an elevation after partial vein occlusion were observed in the mean venous pressure (C).

