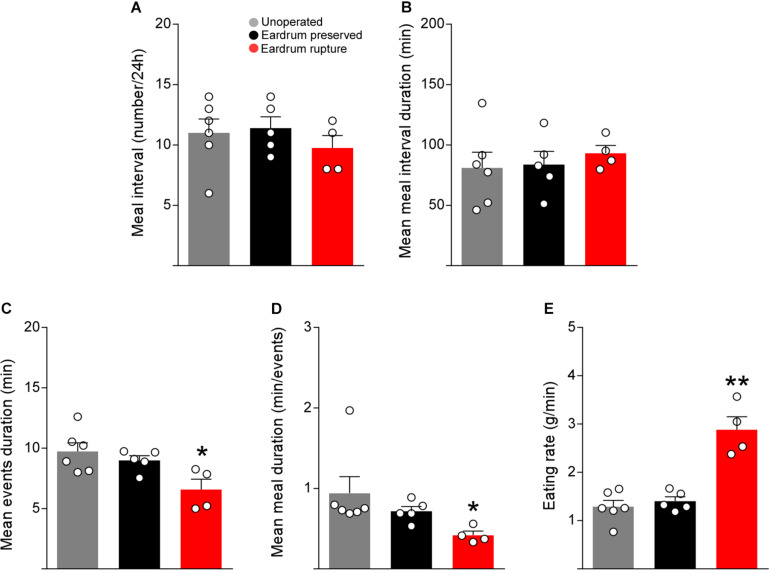
FIGURE 4.
Tympanic membrane rupture alter the feeding microstructure parameters. Total meal interval (number) (A), mean meal interval duration (min) (B), meal events duration (min) (C), mean meal duration (min/events) (D), eating rate (g/min) (E) at day 5 post-surgery in cannulated rats following the protocol 1 (black bars) or protocol 2 (red bars). As a control, non-cannulated rats were used (gray bars). The data are expressed as mean ± SEM. Kruskal-Wallis test (Dunn’s multiple comparisons test), *p < 0.05, **p < 0.01.

