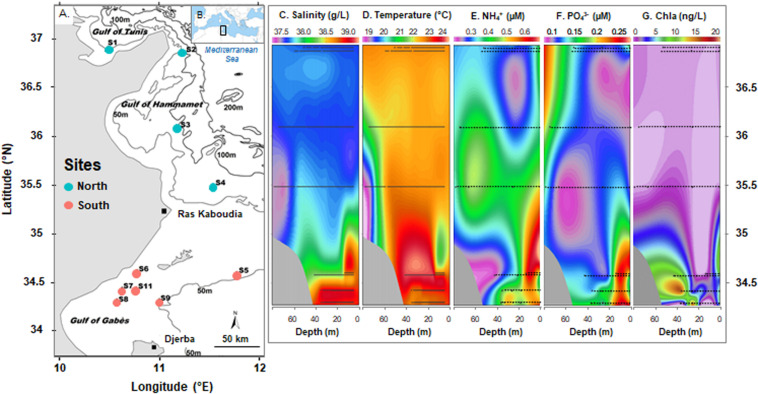
FIGURE 1.
Sampling sites along the Tunisian coast during INCOMMET cruise (A) in the South Mediterranean Sea (B) with vertical profiles of salinity (C), temperature (D), ammonium (E), orthophosphate (F), and chlorophyll a (Chla) (G) concentrations along the section defined by the station latitude from the Gulf of Tunis to the Gulf of Gabès (modified from Khammeri et al., 2020). Stations are indicated by blue or red circles (for North or South bays) on map. Stations and sample depth are indicated by line in vertical profiles.

