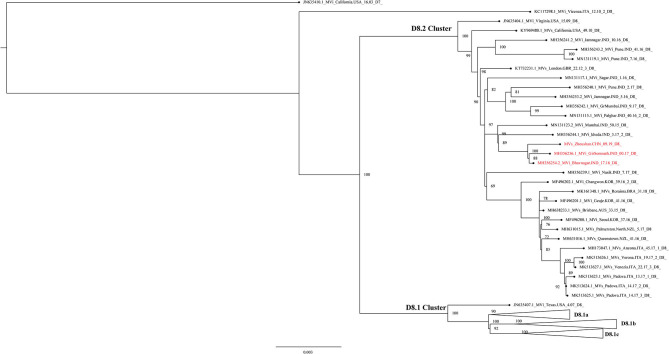
Figure 4.
Maximum-likelihood phylogenetic tree of D8 genotype strains based on the complete genome. ML phylogenetic tree showing the genetic relationship among MeV isolates. The triangle represents the D8.1 sub-cluster. The black dot represents each Mev sequence. The scale bar is given in substitutions/site.

