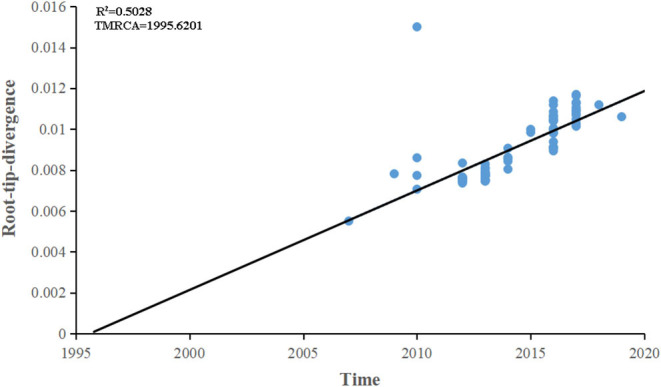
Figure 5.

Root-to-tip regression of a maximum-likelihood (ML) phylogenetic tree of complete genome of D8 genotype strains. The correlation between genetic divergence and sampling time was calculated by R2. The time of the most recent common ancestor was designated by the X intercept.
